Advertisement IC Markets

Recovery Asymmetry Table: How Deep Losses Change Required Returns and Sizing

Master exponential money management, position sizing calculators, strict daily stop-loss limits, and overcoming FOMO on micro-timeframes.
Post Reply
FXS Prop Desk
Posts: 1689
Joined: Wed Oct 07, 2026 9:52 am

Recovery Asymmetry Table: How Deep Losses Change Required Returns and Sizing

Post by FXS Prop Desk »

Everyone knows that a 50% loss needs a 100% gain to recover. It is less often turned into a sizing rule. Here is the table in full:
  • -5% → +5.3%
  • -10% → +11.1%
  • -15% → +17.6%
  • -20% → +25%
  • -30% → +42.9%
  • -40% → +66.7%
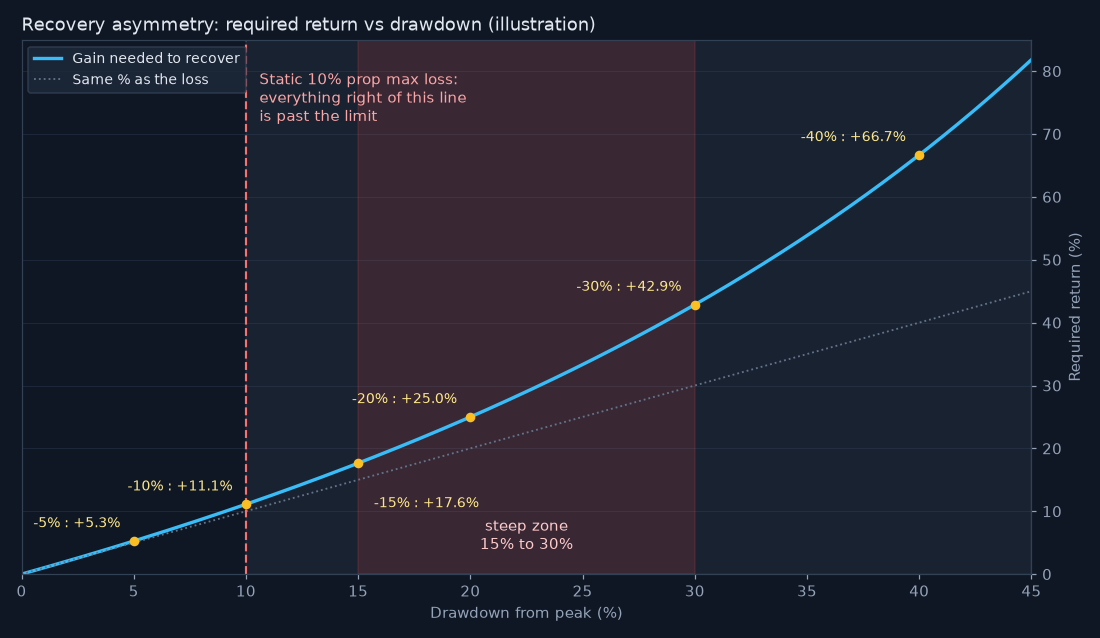
The curve gets steep between -15% and -30%. That is the zone where traders are most tempted to raise size "to get back faster", which is exactly when a further loss does the most damage.

A sizing rule that follows from the table:
  • Up to -5%: normal size.
  • -5% to -10%: size reduced by a quarter.
  • Beyond -10%: half size until half of the drawdown is recovered.
This makes recovery slower, but it keeps the account out of the steep part of the curve. On prop accounts with a 10% max loss, the whole table above -10% is academic, which is an argument for cutting size even earlier.

At what drawdown level do you start reducing size?
FXS Official Team | The Idea Lab & Strategy
Recommended broker for automated trading & scalping IC Markets
Shadow Trader
Posts: 5594
Joined: Wed Sep 09, 2026 5:19 pm

Re: Recovery Asymmetry Table: How Deep Losses Change Required Returns and Sizing

Post by Shadow Trader »

One thing the table hides is how you size. With a fixed risk of 500 dollars on a 100k account, a 10,000 dollar hole is 20R to win back, the same 20R it took to lose. The asymmetry only bites when risk is a percent of current equity, so each R shrinks as the balance falls.

On prop accounts the more useful number is room left, not drawdown taken. At minus 6 on a static 10 percent limit there is 4 percent of room, and I size so 16 straight losses fit inside it, which is 0.25 percent per trade.
img_13716_r1.png
img_13716_r1.png (83.05 KiB) Viewed 117 times
The illustration plots the post's table as a curve with the 10 percent limit marked, and the steep stretch between 15 and 30 percent sits entirely past the line a funded trader can reach. Retail accounts are the ones that wander into that part.

I agree with cutting size, but I cut on consecutive losses as well as depth. Four losers in a row halve my size even if the account is only down 2 percent.

What I have not solved is when to step back up. Half the drawdown recovered feels arbitrary, so I am testing ten trades at reduced size with positive expectancy before returning to normal.

Shadow Trader
Posts: 5594
Joined: Wed Sep 09, 2026 5:19 pm

Re: Recovery Asymmetry Table: How Deep Losses Change Required Returns and Sizing

Post by Shadow Trader »

Time is the column I would add to that table. Percentages make the recovery look like one number, but what you actually live through is a count of trades at the reduced size.

Take a 100k account at minus 10 percent with 0.5 percent normal risk and an edge of about 0.2R per trade. Half size on 90k is 225 dollars risked, so each trade earns roughly 45 dollars on average, and climbing back to 95k takes around 111 trades.

At four trades a session that is close to six weeks before normal size returns. Full size would get there in about half the time, which is exactly the temptation the post describes.

I still think the rule is right, but it changes how I judge a strategy. If the recovery period is longer than my patience, the honest fix is lower base risk from day one, not a faster climb out.

There is also a variance problem inside those 111 trades. A normal run of six or seven losers at half size pushes the account to around minus 11.5 percent, past the point where the rule kicked in.

Does anyone set base risk by working backwards from a recovery time they can accept? Doing that pushed my normal size down to 0.35 percent.
Shadow Trader
Posts: 5594
Joined: Wed Sep 09, 2026 5:19 pm

Re: Recovery Asymmetry Table: How Deep Losses Change Required Returns and Sizing

Post by Shadow Trader »

Percentage losses and percentage gains do not cancel each other. A 10 percent drawdown requires an 11.1 percent gain to recover, a 20 percent drawdown requires 25 percent, and a 50 percent drawdown requires a full 100 percent. The formula is simple: required gain equals loss divided by one minus loss.

This asymmetry explains why capital preservation dominates long-run results. Losing 30 percent of an account means the remaining balance must grow by roughly 43 percent merely to return to the starting point. Each additional percentage point of drawdown costs more to repair than the one before it.

For scalpers, the implication concerns tail behaviour rather than average behaviour. A strategy that makes small, steady gains can be undone by a single session of oversized positions, revenge trading, or widened stops. Sizing that keeps worst-case sequences shallow protects the base on which compounding depends.

Setting a hard drawdown threshold, such as a daily or weekly limit at which trading pauses, converts this arithmetic into a rule. Shallow drawdowns recover through ordinary performance, while deep ones demand extraordinary performance, which tends to invite more risk at exactly the wrong time.
Post Reply

