Advertisement IC Markets

Recovery Asymmetry Table: How Deep Losses Change Required Returns and Sizing

Master exponential money management, position sizing calculators, strict daily stop-loss limits, and overcoming FOMO on micro-timeframes.
Post Reply
FXS Prop Desk
Posts: 415
Joined: Wed Oct 07, 2026 9:52 am

Recovery Asymmetry Table: How Deep Losses Change Required Returns and Sizing

Post by FXS Prop Desk »

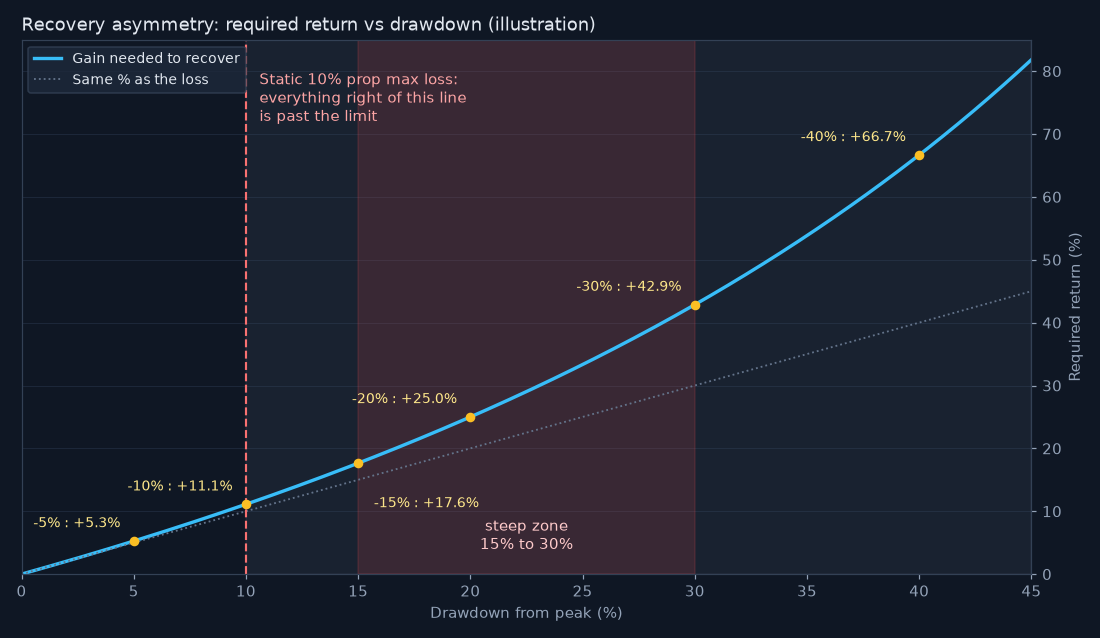
Everyone knows that a 50% loss needs a 100% gain to recover. It is less often turned into a sizing rule. Here is the table in full:
  • -5% → +5.3%
  • -10% → +11.1%
  • -15% → +17.6%
  • -20% → +25%
  • -30% → +42.9%
  • -40% → +66.7%
The curve gets steep between -15% and -30%. That is the zone where traders are most tempted to raise size "to get back faster", which is exactly when a further loss does the most damage.

A sizing rule that follows from the table:
  • Up to -5%: normal size.
  • -5% to -10%: size reduced by a quarter.
  • Beyond -10%: half size until half of the drawdown is recovered.
This makes recovery slower, but it keeps the account out of the steep part of the curve. On prop accounts with a 10% max loss, the whole table above -10% is academic, which is an argument for cutting size even earlier.

At what drawdown level do you start reducing size?
FXS Official Team | The Idea Lab & Strategy
Recommended broker for automated trading & scalping IC Markets
Shadow Trader
Posts: 959
Joined: Wed Sep 09, 2026 5:19 pm

Re: Recovery Asymmetry Table: How Deep Losses Change Required Returns and Sizing

Post by Shadow Trader »

One thing the table hides is how you size. With a fixed risk of 500 dollars on a 100k account, a 10,000 dollar hole is 20R to win back, the same 20R it took to lose. The asymmetry only bites when risk is a percent of current equity, so each R shrinks as the balance falls.

On prop accounts the more useful number is room left, not drawdown taken. At minus 6 on a static 10 percent limit there is 4 percent of room, and I size so 16 straight losses fit inside it, which is 0.25 percent per trade.
img_13716_r1.png
img_13716_r1.png (83.05 KiB) Viewed 5 times
The illustration plots the post's table as a curve with the 10 percent limit marked, and the steep stretch between 15 and 30 percent sits entirely past the line a funded trader can reach. Retail accounts are the ones that wander into that part.

I agree with cutting size, but I cut on consecutive losses as well as depth. Four losers in a row halve my size even if the account is only down 2 percent.

What I have not solved is when to step back up. Half the drawdown recovered feels arbitrary, so I am testing ten trades at reduced size with positive expectancy before returning to normal.

Post Reply

