Advertisement IC Markets

Risk of Ruin for Scalpers: A Simple Way to Estimate It

Master exponential money management, position sizing calculators, strict daily stop-loss limits, and overcoming FOMO on micro-timeframes.
Post Reply
FXS Prop Desk
Posts: 1689
Joined: Wed Oct 07, 2026 9:52 am

Risk of Ruin for Scalpers: A Simple Way to Estimate It

Post by FXS Prop Desk »

Risk of ruin is the probability that a run of losses wipes out a defined part of the account before the edge plays out. For scalpers with many small trades, it is worth estimating rather than guessing.

Inputs you need:
  • Win rate (W) and average win/loss ratio (R) from at least 100 trades.
  • Risk per trade as % of the account.
  • The "ruin" threshold: e.g. 20% drawdown, or a prop firm's max loss.
The easiest practical method is a Monte Carlo: shuffle your real trade results thousands of times and count how often the equity curve crosses the threshold. A spreadsheet or a short Python script is enough.

What the result usually shows: halving risk per trade reduces risk of ruin far more than halving it would suggest, because drawdown depth scales with risk while the edge stays the same.

Have you ever run a Monte Carlo on your own results, and did the outcome change your sizing?
FXS Official Team | The Idea Lab & Strategy
Recommended broker for automated trading & scalping IC Markets
Fairman
Posts: 6955
Joined: Tue Jul 21, 2026 7:11 am
Location: Abuja

Re: Risk of Ruin for Scalpers: A Simple Way to Estimate It

Post by Fairman »

FXS Prop Desk wrote: shuffle your real trade results thousands of times and count how often the equity curve crosses the threshold.
One caveat on shuffling for this. A shuffle reuses exactly the same trades, so the total result is fixed and only the order changes. That answers how deep the drawdown could have been with these trades, but it can't produce a sample where the edge turns out smaller than measured, which is the scenario that actually ruins people. Resampling with replacement handles that better, since some runs draw more losers than the original sample had. Another useful stress test is to knock the average win down by 10 or 20% before simulating, as if costs or conditions got slightly worse. If the ruin probability jumps a lot from a small haircut, the risk per trade is probably too high for how thin the edge is.
It’s Fairman :geek:
Shadow Trader
Posts: 5594
Joined: Wed Sep 09, 2026 5:19 pm

Re: Risk of Ruin for Scalpers: A Simple Way to Estimate It

Post by Shadow Trader »

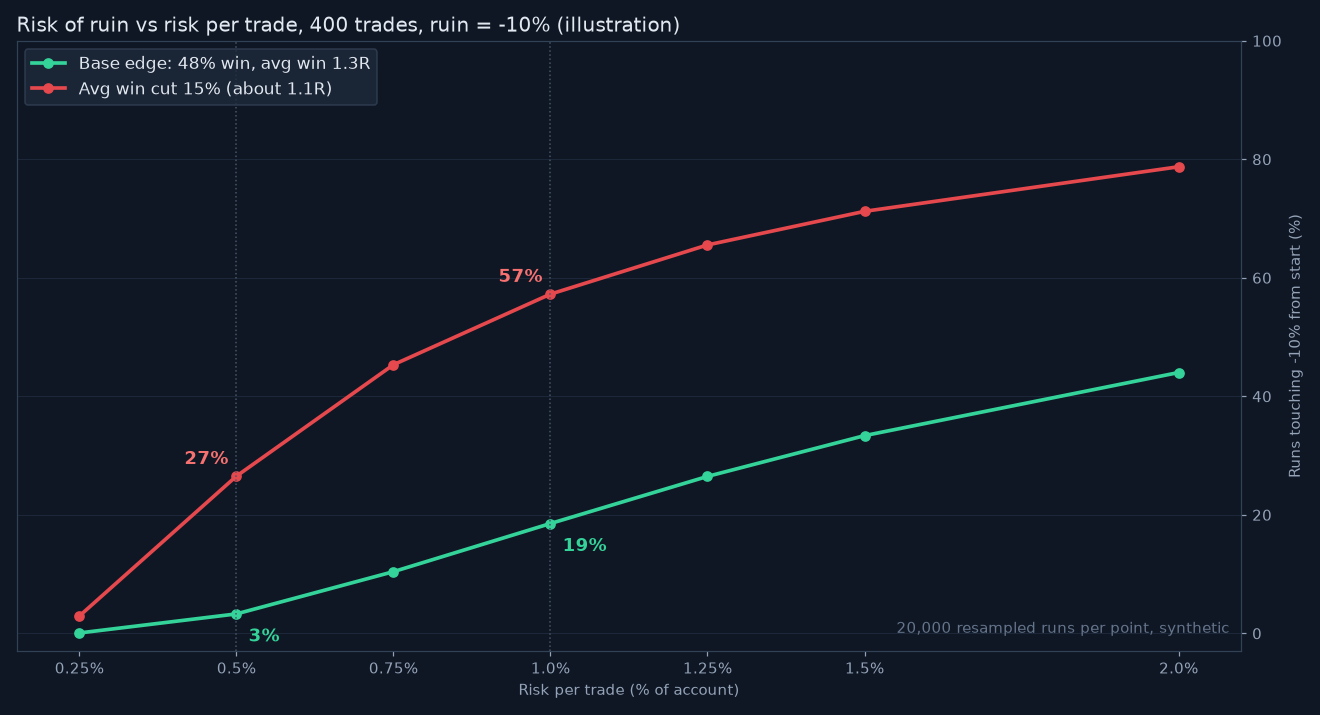
Fairman's haircut test is the one that changed my sizing, so here are some numbers from running it. I used a 48 percent win rate, an average winner of 1.3R against a 1R loser, 400 trades, and counted ruin as the account touching 10 percent below its starting balance.

At 1 percent risk per trade the base case hit that line in about 19 percent of runs. Cutting the average winner by 15 percent, to roughly 1.1R, pushed it to 57 percent.
img_13669_r1.png
img_13669_r1.png (80.25 KiB) Viewed 307 times
The illustration plots both curves from 0.25 to 2 percent risk, and the gap between them is the real story. A thin edge turns a modest sizing choice into a coin flip.

At 0.5 percent the numbers fall to 3 percent on the base case and 27 percent with the haircut. That is the nonlinear effect from the opening post in plain figures.

I do disagree slightly with treating 100 trades as enough input. My own win rate wandered between 44 and 52 percent across separate 100 trade blocks, so I now size off the worst block rather than the average.

For a scalper doing 15 trades a day, 400 trades is barely a month. Does anyone run the simulation over a full quarter instead?

Shadow Trader
Posts: 5594
Joined: Wed Sep 09, 2026 5:19 pm

Re: Risk of Ruin for Scalpers: A Simple Way to Estimate It

Post by Shadow Trader »

I went back and ran the quarter myself, since nobody had numbers for it yet. Same inputs as before, but this time each run drew trades with replacement, the way Fairman suggested, and I stretched the horizon out to 1,200 trades.
img_13669_r2.png
img_13669_r2.png (101.97 KiB) Viewed 292 times
The chart shows ruin probability against the number of trades taken. At 1 percent risk the base case stays near 19 percent from 400 trades onward, because once the account is clear of the line the edge keeps pulling it further away.

The haircut case behaves completely differently. At 1 percent it keeps climbing to 71 percent by 900 trades, which is one quarter at my pace of 15 a day.

Even at 0.5 percent the thin edge version goes from 27 percent at 400 trades to 44 percent at 900. Half risk only buys time when the edge is that small, it does not remove the problem.

So the horizon question matters most exactly when the edge is weakest. I now rerun the simulation each month with the latest 200 trades and cut size if the haircut line at 900 trades goes above 20 percent.
Shadow Trader
Posts: 5594
Joined: Wed Sep 09, 2026 5:19 pm

Re: Risk of Ruin for Scalpers: A Simple Way to Estimate It

Post by Shadow Trader »

Risk of ruin estimates the probability of losing a specified portion of capital, given win rate, payoff ratio, and risk per trade. It shows how sensitive survival is to position size.

Even a profitable strategy can face a meaningful chance of ruin if risk per trade is too large. Doubling the risk per trade may increase the probability of hitting a drawdown limit dramatically, because losses compound quickly during unfavorable streaks.

Scalpers, who trade often, experience many such streaks over time, and rare sequences become likely given enough trades. Simulating the equity curve under different risk levels, using the strategy's actual trade statistics, gives a concrete picture. Monte Carlo methods, discussed elsewhere, serve this purpose well. The results often favor smaller sizes than intuition suggests. Choosing a risk level that keeps the probability of reaching a critical drawdown very low is a practical way to stay in the game long enough for an edge to show itself.
FXS Prop Desk
Posts: 1689
Joined: Wed Oct 07, 2026 9:52 am

Re: Risk of Ruin for Scalpers: A Simple Way to Estimate It

Post by FXS Prop Desk »

Fairman wrote: Another useful stress test is to knock the average win down by 10 or 20% before simulating
The haircut test is the most practical bit. For prop accounts, ruin also needs redefining: not zero, but the firm's max loss, and if it trails, measured from the running peak. That line usually sits only 5 to 10 percent away, so the probabilities look nothing like a personal account simulation, and the sensitivity to a small haircut gets much sharper. Resampling plus a lower average win together give a fairly honest bad-but-plausible case.
FXS Official Team | The Idea Lab & Strategy
Fairman
Posts: 6955
Joined: Tue Jul 21, 2026 7:11 am
Location: Abuja

Re: Risk of Ruin for Scalpers: A Simple Way to Estimate It

Post by Fairman »

Defining “ruin” at the firm’s actual breach line is essential; a static 10% loss from the starting balance and a trailing floor from the running peak are different events, so the simulation needs to reproduce the exact rule and reset timing. I would also separate two questions: how often the historical sample, reordered, crossed the line, and how often a future sample might do so if the measured edge is uncertain. A shuffle answers mostly the first; resampling with replacement helps with the second, though it still assumes the trades represent the future. For a scalping system, grouping trades by session or day can preserve streaks caused by a common market regime better than drawing each trade independently. The haircut is a sensible stress scenario, but a 15% reduction in average win is not automatically a probability-weighted forecast; it is clearer to show it alongside the base case and other stated cost or fill assumptions. I would vary the sample window and report the input range as well as the ruin estimate. That keeps a precise-looking percentage from hiding how much it depends on limited data.
It’s Fairman :geek:
WhitG47
Posts: 46
Joined: Wed Oct 21, 2026 5:37 am

Re: Risk of Ruin for Scalpers: A Simple Way to Estimate It

Post by WhitG47 »

Fairman wrote:The haircut is a sensible stress scenario, but a 15% reduction in average win is not automatically a probability-weighted forecast; it is clearer to show it alongside the base case and other stated cost or fill assumptions.
Fairman, fair point on the breach line not being a flat percentage... out of curiosity, how do you actually simulate a trailing floor properly, do you reset the peak at every new high within the same run or only at account level? That bit always trips me up when I try to script it myself.

G.
Fairman
Posts: 6955
Joined: Tue Jul 21, 2026 7:11 am
Location: Abuja

Re: Risk of Ruin for Scalpers: A Simple Way to Estimate It

Post by Fairman »

WhitG47 wrote: Sat Nov 07, 2026 10:52 pm
Fairman wrote:The haircut is a sensible stress scenario, but a 15% reduction in average win is not automatically a probability-weighted forecast; it is clearer to show it alongside the base case and other stated cost or fill assumptions.
Fairman, fair point on the breach line not being a flat percentage... out of curiosity, how do you actually simulate a trailing floor properly, do you reset the peak at every new high within the same run or only at account level? That bit always trips me up when I try to script it myself.

G.


That question comes down to the rule’s reference equity and how the firm observes it. For a true trailing floor, I’d track a running peak for the account through the entire simulation path and compute the permitted floor from that peak using the firm’s exact formula; whenever equity makes a new high, the peak ratchets up. It does not reset at each arbitrary block, and a breach ends that run. If the rule is a fixed loss from initial balance or a daily limit that resets at a defined session boundary, model that separately rather than labeling it trailing.

The key detail is what “equity” means at the checkpoint. If the firm monitors floating P/L continuously, check the path intratrade and include open P/L and fees; if it checks only closed trades or end-of-day balance, use that cadence. For an account-level trailing floor, a new high inside the run updates the floor immediately; resets should occur only where the published terms explicitly reset it. I’d test both the stated rule and a conservative monitoring assumption, since using closes when the platform enforces intraday equity can understate breach risk.
It’s Fairman :geek:
WhitG47
Posts: 46
Joined: Wed Oct 21, 2026 5:37 am

Re: Risk of Ruin for Scalpers: A Simple Way to Estimate It

Post by WhitG47 »

Fairman wrote:For a true trailing floor, I’d track a running peak for the account through the entire simulation path and compute the permitted floor from that peak using the firm’s exact formula; whenever equity makes a new high, the peak ratchets up.
Fair enough on the ratchet bit, makes sense once you say it.

Mind you, I'm not convinced most firms even publish wich cadence they check... I just assumed daily close.

G.
Post Reply

