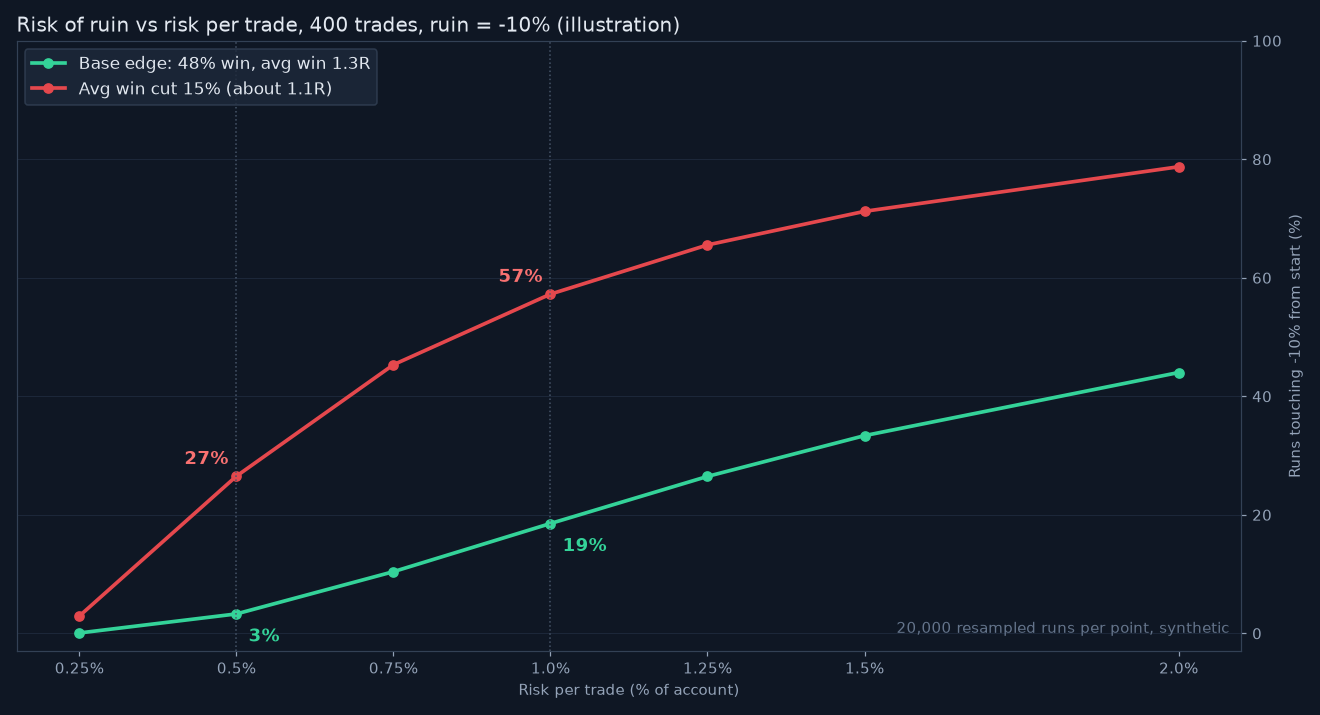
Fairman's haircut test is the one that changed my sizing, so here are some numbers from running it. I used a 48 percent win rate, an average winner of 1.3R against a 1R loser, 400 trades, and counted ruin as the account touching 10 percent below its starting balance.
At 1 percent risk per trade the base case hit that line in about 19 percent of runs. Cutting the average winner by 15 percent, to roughly 1.1R, pushed it to 57 percent.
- img_13669_r1.png (80.25 KiB) Viewed 9 times
The illustration plots both curves from 0.25 to 2 percent risk, and the gap between them is the real story. A thin edge turns a modest sizing choice into a coin flip.
At 0.5 percent the numbers fall to 3 percent on the base case and 27 percent with the haircut. That is the nonlinear effect from the opening post in plain figures.
I do disagree slightly with treating 100 trades as enough input. My own win rate wandered between 44 and 52 percent across separate 100 trade blocks, so I now size off the worst block rather than the average.
For a scalper doing 15 trades a day, 400 trades is barely a month. Does anyone run the simulation over a full quarter instead?



