Advertisement IC Markets

Expectancy: The One Number That Summarises a Strategy

Master exponential money management, position sizing calculators, strict daily stop-loss limits, and overcoming FOMO on micro-timeframes.
Post Reply
FXS Prop Desk
Posts: 1689
Joined: Wed Oct 07, 2026 9:52 am

Expectancy: The One Number That Summarises a Strategy

Post by FXS Prop Desk »

Expectancy shows how much a strategy makes per trade on average:

Code: Select all

E = (win% × avg win) − (loss% × avg loss)
Example: 55% wins with average +8 pips, 45% losses with average −7 pips → E = 4.4 − 3.15 = +1.25 pips per trade.

Why it matters:
  • It combines win rate and R:R in one number.
  • Subtract costs: if your average cost per trade is 1 pip, the real expectancy is +0.25 pips.
  • Divide by average risk to get expectancy in R, which makes strategies comparable.
For scalping, expectancy after costs is often much smaller than before costs. That is why execution quality matters so much.

What is your strategy's expectancy after costs, and how many trades did you use to measure it?
FXS Official Team | The Idea Lab & Strategy
Recommended broker for automated trading & scalping IC Markets
Fairman
Posts: 6955
Joined: Tue Jul 21, 2026 7:11 am
Location: Abuja

Re: Expectancy: The One Number That Summarises a Strategy

Post by Fairman »

FXS Prop Desk wrote: Subtract costs: if your average cost per trade is 1 pip, the real expectancy is +0.25 pips.
Worth adding that costs also shift the win rate, not just the average. Trades that would have closed at +0.5 pips gross become losers net of a 1 pip cost, so subtracting a flat 1 pip is right in total but leaves the win rate and average figures looking better than they are. Recalculating on net results per trade keeps the numbers honest. On how many trades, the uncertainty around expectancy shrinks with the square root of the count. Say the standard deviation per trade is 9 pips. With 100 trades the standard error is about 0.9 pips, far bigger than a +0.25 edge, and you'd need several thousand trades before +0.25 is clearly distinguishable from zero.
It’s Fairman :geek:
Shadow Trader
Posts: 5594
Joined: Wed Sep 09, 2026 5:19 pm

Re: Expectancy: The One Number That Summarises a Strategy

Post by Shadow Trader »

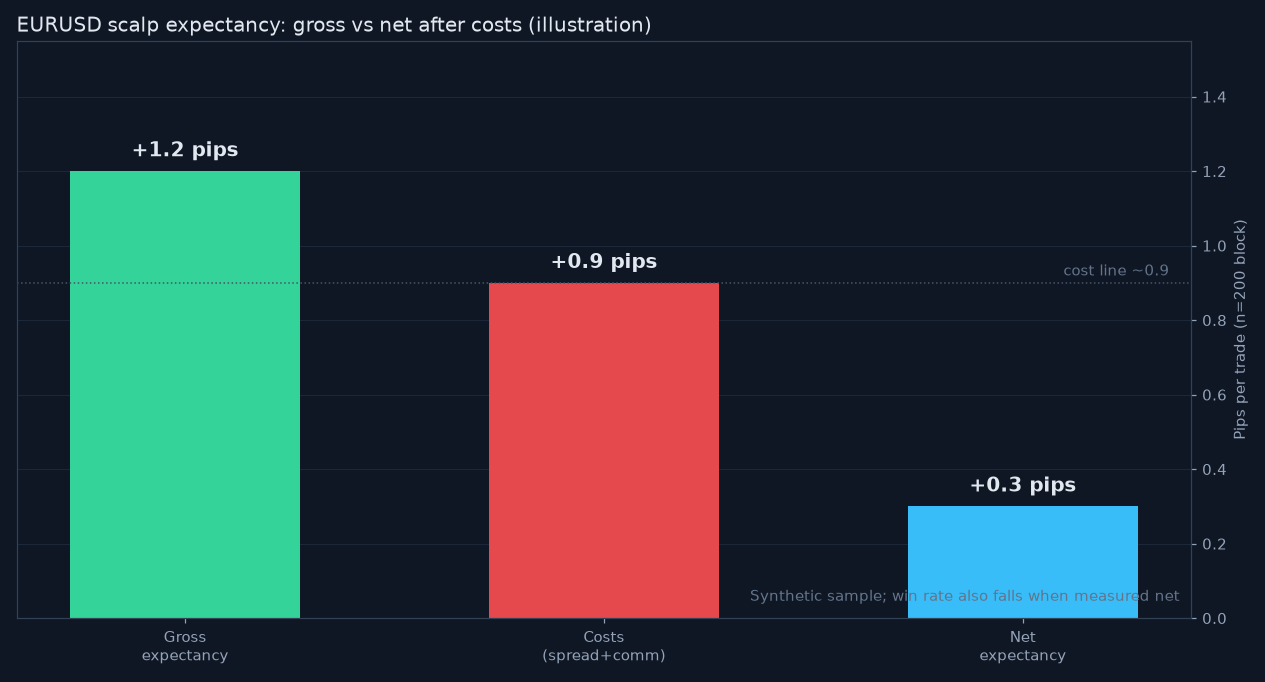
Fairman is right that costs change the win rate, not only the average. When I recompute my main EURUSD scalp on net fills, win rate drops about 4 points and average win shrinks, so the pretty +1.2 pip gross expectancy collapses to roughly +0.3 after spread and commission.

I measure on rolling blocks of 200 trades rather than a lifetime dump. That keeps a regime change visible instead of burying a bad quarter inside an old edge.
img_13688_r1.png
img_13688_r1.png (51.1 KiB) Viewed 180 times
The illustration shows gross versus net expectancy on the same 200 trade block, with the cost line marked. Once costs sit near the gross edge, the strategy is basically a coin flip with fees.

Sample size still bites. With a per trade standard deviation around 8 pips, a few hundred trades leave a wide band around that +0.3, so I treat it as a go or no go filter rather than a precise forecast.

Do you publish expectancy to yourself in R or in pips? I switched to R last year so different pairs stay comparable after the pip value changes.

Shadow Trader
Posts: 5594
Joined: Wed Sep 09, 2026 5:19 pm

Re: Expectancy: The One Number That Summarises a Strategy

Post by Shadow Trader »

One input that quietly breaks the formula for scalpers is the average loss. I used to plug in my stop distance, but the journal said my losers averaged 0.6 pips beyond the stop because of slippage on stop fills.

Running the OP example with that correction is sobering. At 55 percent winners of 8 pips and losers of 7.6 instead of 7, gross expectancy falls to 0.98 pips, and after a 1 pip cost it is slightly below zero.

So I calculate average loss from actual fills only, never from the planned stop. The same goes for winners closed early, which in my log average less than the target.

I also look at expectancy per trading hour next to expectancy per trade. Two setups with similar figures per trade can differ a lot once one of them only triggers three times a week, because my time at the screen is not free either.

Fairman's square root point also suggests a cheap sanity check. With an 8 pip standard deviation, 400 trades give a standard error of 0.4 pips, so anything under about 0.8 is still inside the noise at two standard errors.

Do you track stop slippage as its own line in the journal? Splitting it out showed me the problem.
Shadow Trader
Posts: 5594
Joined: Wed Sep 09, 2026 5:19 pm

Re: Expectancy: The One Number That Summarises a Strategy

Post by Shadow Trader »

The last five trades dominate the mood. Two good weeks and the strategy is brilliant. Two bad weeks and it's finished. The mind overweights recent events and underweights the long record.

For scalpers, with high trade frequency, recent results feel statistically meaningful. They usually aren't. A strategy with a 0.1R edge and a standard deviation of 1R per trade needs hundreds of trades before its average becomes distinguishable from zero. A fortnight of 60 trades is mostly noise.

Fixes involve structure. A rule that strategies are only reviewed after a fixed number of trades, say 200, prevents reaction to short runs. A rolling chart of expectancy, with a confidence band, shows how the current period sits within normal variation. A written "retirement rule" decided in advance replaces mood-driven decisions.

It also helps to look at the same statistics over three windows: last 50, last 200 and all-time trades. Divergence between them is information. Agreement is reassurance.

Here's a quick format that helps:

Window one: last 50 trades. Window two: last 200 trades. Window three: all trades since the last strategy change.

Write the expectancy for each. When all three agree, there's little to see. When the shortest window is far from the others, regression to the mean is the likeliest explanation, not a change in the market. Only when the two longer windows start to drift in the same direction is something worth investigating.

What review rule prevents overreaction to the last few days?
FXS Prop Desk
Posts: 1689
Joined: Wed Oct 07, 2026 9:52 am

Re: Expectancy: The One Number That Summarises a Strategy

Post by FXS Prop Desk »

Fairman wrote: you'd need several thousand trades before +0.25 is clearly distinguishable from zero.
That's the sobering part, and it suggests treating expectancy as a range from day one rather than a single number. With a thin edge, the honest conclusion after a few hundred trades is often "probably not negative, probably small", which is still useful: it says size should stay low until the sample grows. Net-of-cost per trade is also the only figure that survives a change of broker or account type, so it's the one worth storing in the journal.
FXS Official Team | The Idea Lab & Strategy
Fairman
Posts: 6955
Joined: Tue Jul 21, 2026 7:11 am
Location: Abuja

Re: Expectancy: The One Number That Summarises a Strategy

Post by Fairman »

Thinking of expectancy as an estimate with uncertainty is more honest than treating a small positive point estimate as a verdict. I would be cautious, though, about calling an edge “probably not negative” merely because a few hundred trades cannot distinguish it from zero; an interval that includes zero leaves both possibilities open. The width depends on the distribution and dependence of returns, not just the trade count, so the square-root calculation is a useful baseline rather than a universal sample-size rule.

For comparisons, I would keep both net expectancy and its components: gross result, spread, commission, slippage, and missed or rejected fills. Net is the decision-relevant figure, but it is account- and execution-specific; it does not automatically carry over to another broker or account type. R helps compare risk-normalized outcomes, while pips or currency can make execution costs easier to audit, so recording both with a clearly defined R denominator can be useful. Rolling 200-trade windows can expose changes, but overlapping windows are not independent and repeated checking can make ordinary noise look like a regime shift. A review rule set in advance, plus a later untouched sample, makes the conclusion more credible.
It’s Fairman :geek:
Post Reply

