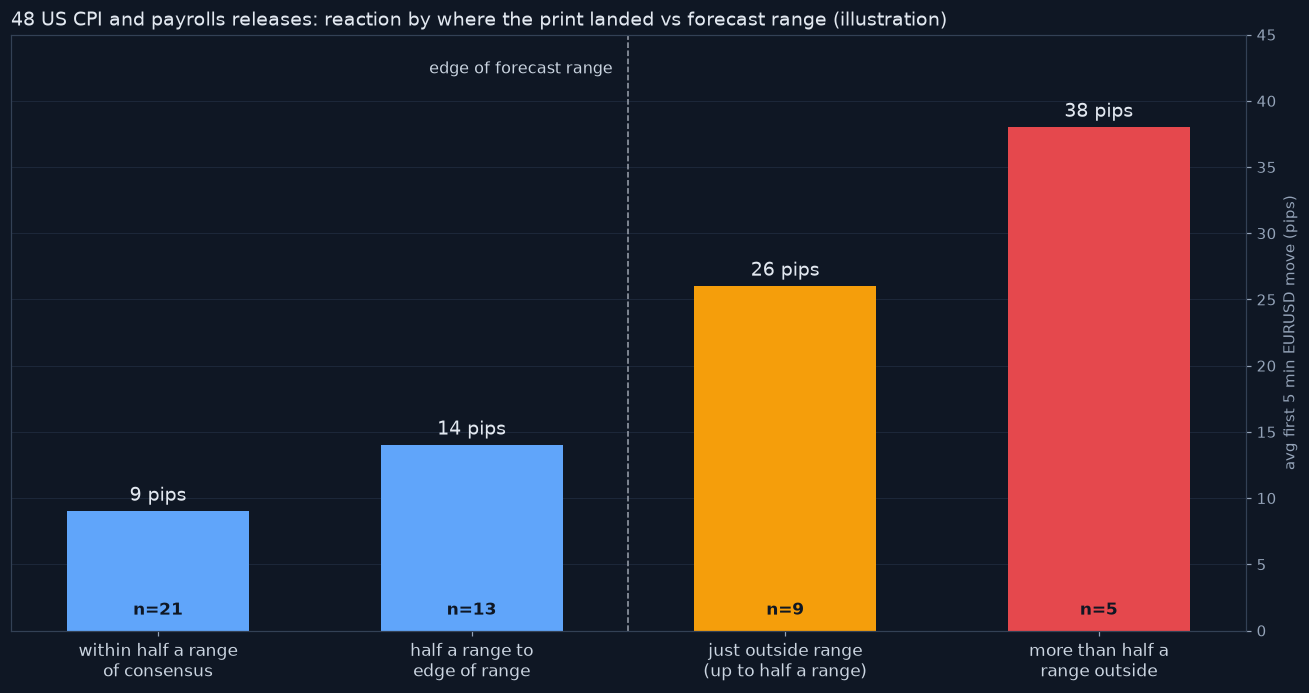
I finally sorted my sheet by where the print landed relative to the forecast range rather than by raw miss. That covers 48 US CPI and payrolls releases, scored as the miss divided by half the range, with the first five minute EURUSD move as the reaction.
- img_13595_r2.png (62.1 KiB) Viewed 80 times
The chart shows the average move for each bucket. Prints within half a range of consensus averaged 9 pips, prints between that and the edge of the range 14 pips, and prints just outside the range jumped to 26.
The five releases that landed more than half a range outside the band averaged 38 pips. That last bucket is tiny, so I read it as direction rather than a number to size from.
One problem with the range itself is stale estimates. A single forecaster who has not updated in two weeks can stretch the low end, so I drop the highest and lowest estimate when the provider shows the full list.
That trimmed range answered my own question from last time. When dispersion is wide, the range now matters more to me than the median, because a big raw miss inside a wide band barely moved the pair.


