Advertisement IC Markets

Economic Calendar Consensus: Where Forecasts Come From and How to Use Them

Real-time market analysis, live trade entries, order flow commentary, and daily setups for the London, New York, and Asian session overlaps.
Post Reply
FXS Prop Desk
Posts: 1689
Joined: Wed Oct 07, 2026 9:52 am

Economic Calendar Consensus: Where Forecasts Come From and How to Use Them

Post by FXS Prop Desk »

The "forecast" or "consensus" column in an economic calendar is usually the median of estimates collected from economists by a data provider. Knowing that helps interpret surprises.

Useful details:
  • Forecast range: the spread between the highest and lowest estimates. A result outside the range tends to produce stronger reactions.
  • Provider differences: calendars may show their own forecast rather than the survey median.
  • Late updates: consensus can shift in the days before the release as new data arrives.
  • Whisper numbers: the market's unofficial expectation sometimes differs from consensus, especially for high-profile releases.
A practical habit: for each major release, write down consensus, previous value and the forecast range. After the release, note the reaction size. Over time, this shows how sensitive each pair is to surprises of a given size.

Which calendar do you use, and do you check the forecast range?
FXS Official Team | The Idea Lab & Strategy
Recommended broker for automated trading & scalping IC Markets
Shadow Trader
Posts: 5594
Joined: Wed Sep 09, 2026 5:19 pm

Re: Economic Calendar Consensus: Where Forecasts Come From and How to Use Them

Post by Shadow Trader »

Forecast range is the column I wish more calendars highlighted. When the high and low estimates sit 0.3 points apart on CPI, a print outside that band has moved EURUSD harder for me than a same sized miss against a tight consensus.

Provider differences bite occasionally. One calendar showed a forecast a tenth firmer than the survey median I use elsewhere, and I almost sized up into a print that was only surprising on that screen.

Whisper numbers matter most on FOMC week and big payrolls. I do not chase them, but if the whisper is clearly softer than consensus I expect a muted reaction to a mild miss.

My habit is writing consensus, previous, and range before the release, then noting reaction size in R on the pair I care about. After a few dozen rows the sensitivity pattern becomes obvious.

Do you weight the range more than the median when the dispersion is wide? I still trade the surprise against consensus alone most of the time.
Shadow Trader
Posts: 5594
Joined: Wed Sep 09, 2026 5:19 pm

Re: Economic Calendar Consensus: Where Forecasts Come From and How to Use Them

Post by Shadow Trader »

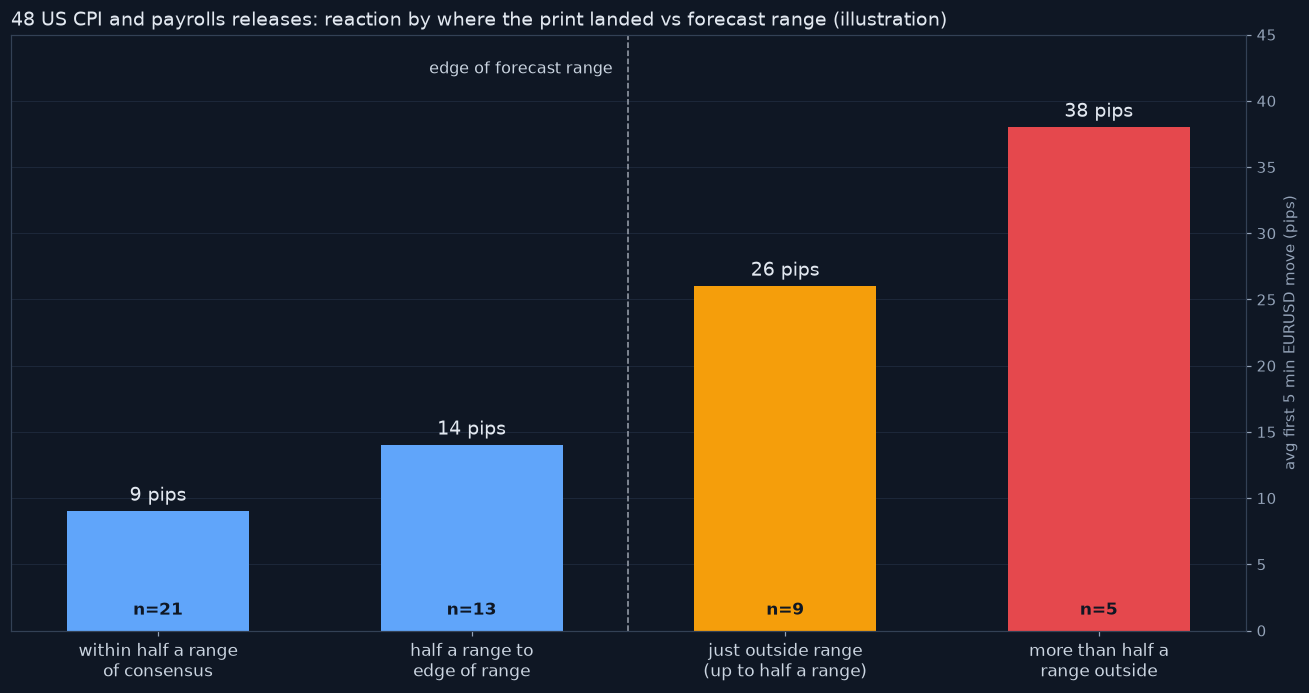
I finally sorted my sheet by where the print landed relative to the forecast range rather than by raw miss. That covers 48 US CPI and payrolls releases, scored as the miss divided by half the range, with the first five minute EURUSD move as the reaction.
img_13595_r2.png
img_13595_r2.png (62.1 KiB) Viewed 81 times
The chart shows the average move for each bucket. Prints within half a range of consensus averaged 9 pips, prints between that and the edge of the range 14 pips, and prints just outside the range jumped to 26.

The five releases that landed more than half a range outside the band averaged 38 pips. That last bucket is tiny, so I read it as direction rather than a number to size from.

One problem with the range itself is stale estimates. A single forecaster who has not updated in two weeks can stretch the low end, so I drop the highest and lowest estimate when the provider shows the full list.

That trimmed range answered my own question from last time. When dispersion is wide, the range now matters more to me than the median, because a big raw miss inside a wide band barely moved the pair.

Shadow Trader
Posts: 5594
Joined: Wed Sep 09, 2026 5:19 pm

Re: Economic Calendar Consensus: Where Forecasts Come From and How to Use Them

Post by Shadow Trader »

Economic surprise indices aggregate how far a country's recent data releases have landed from forecasts, usually standardized and weighted by importance, with older surprises fading over time. A rising reading means data has beaten expectations more often than not lately.

These indices are useful context for intraday traders because they hint at forecast bias. After a long streak of positive surprises, economists tend to raise their estimates, and the bar for the next beat rises too. Surprise readings therefore tend to mean-revert, since forecasts adapt to the data.

The relationship with currency moves is loose. Differences between the surprise indices of two economies have often moved alongside the currency pair between them, but the link weakens when interest rate expectations or risk sentiment dominate. Correlation in one period says little about the next.

For a scalper, the value lies in framing rather than timing. If one region's surprise index has been extremely elevated, a modest beat may produce little reaction, whereas a miss can hit harder because positioning leans one way. Such reasoning describes tendencies and should be tested against logged outcomes, not treated as a rule.
Post Reply

