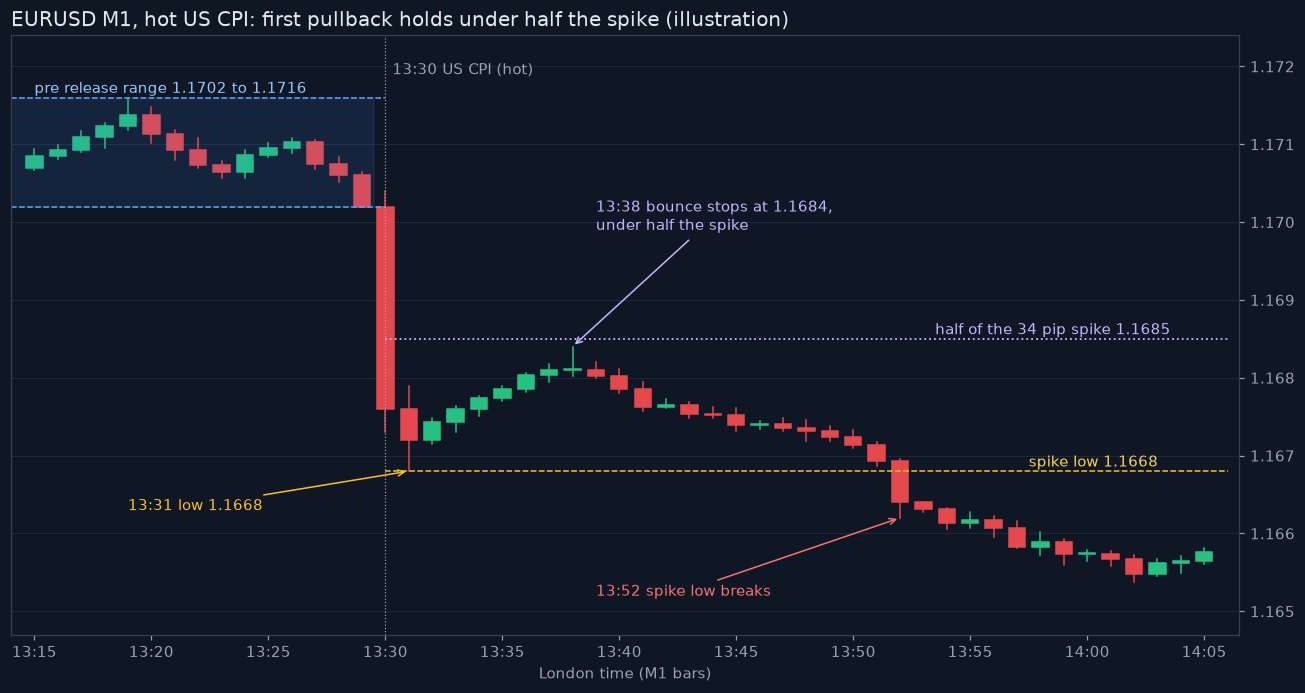
The depth of the first pullback has become my main tell, more than the clock. After the initial spike I measure how much of it the market gives back in the next ten minutes, and that number says more than the yields do.
- img_13456_r2.png (77.32 KiB) Viewed 90 times
The chart is a typical hot US CPI case on EURUSD M1. The pre release range was 1.1702 to 1.1716, the spike ran to 1.1668 by 13:31 London, and the bounce stopped at 1.1684, less than half of the 34 pip drop, before the low broke at 13:52.
In my notes on 40 CPI and payrolls releases, a pullback that held under half the spike went on to make a new extreme about two times in three. When the pullback retraced more than 60 percent, a new extreme came only about one time in five.
Surprise size matters too, but relative to the spread of forecasts rather than the consensus alone. A print one tenth from consensus that sits inside the full forecast range rarely sustains, while a print beyond the highest or lowest forecast produced most of my two in three cases.
Shallow pullbacks after a print inside the range still fail often. Do you look at the forecast range at all, or only the gap to consensus?



