Fairman's point about the stop capping MAE is the reason my first attempt at this told me nothing. I was running a fixed 8 pip stop on EURUSD, so every winner sat inside 8 pips by definition and the plot looked like proof.
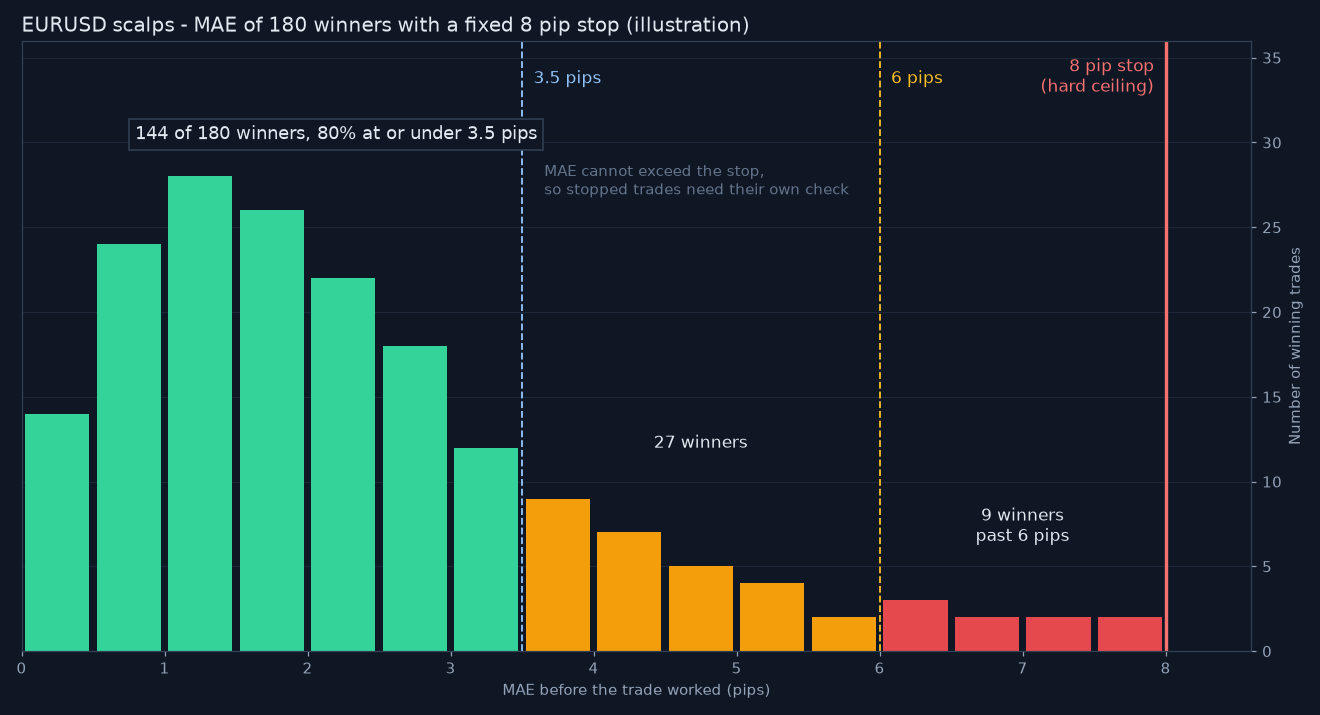
Inside that cap the shape was still useful. Of my last 180 winners, 144 of them, so 80 percent, never went more than 3.5 pips against me, and only 9 went past 6 pips.
- img_13652_r1.png (61.02 KiB) Viewed 9 times
The illustration shows that winner histogram, with the 8 pip stop as the hard ceiling. Almost everything that worked did so before the 4 pip mark.
Next I tested a 6 pip stop on paper instead of 8. The 9 deep winners would have been lost, but every losing trade would have cost 2 pips less, and over that sample the smaller loss came out ahead.
The stopped trades are the harder half. I logged 61 stop-outs and checked how many reached the original target before the session ended, and it was 7, which is too few to argue for a wider stop.
Regime is my open question. Does anyone split MAE by session or volatility, since my Asia winners and my London winners look like two different distributions?



