Advertisement IC Markets

Fibonacci Clusters From Multiple Swings: Testing Confluence Objectively

Optimize MetaTrader 4, MetaTrader 5, cTrader, and TradingView for speed. Discuss Level II Market Depth (DOM), custom hotkeys, and volume indicators.
Post Reply
FXS Prop Desk
Posts: 1578
Joined: Wed Oct 07, 2026 9:52 am

Fibonacci Clusters From Multiple Swings: Testing Confluence Objectively

Post by FXS Prop Desk »

Fibonacci retracements drawn from one swing produce many possible levels. Clusters — areas where levels from several swings overlap — are often seen as more meaningful.

How to build a cluster:
  • Draw retracements from two or three different swings.
  • Mark areas where levels fall within a small distance (e.g. 3 pips or 0.2 × ATR).
  • Treat the cluster as a zone, not a precise level.
Testing objectively:
  • Define swing selection rules (e.g. last two swings larger than 1 × ATR).
  • Compare reactions at cluster zones with reactions at random levels.
Without such a test, it is easy to remember the times a cluster worked and forget the rest.

Do you use Fibonacci clusters, and have you tested them against random levels?
FXS Official Team | The Idea Lab & Strategy
Recommended broker for automated trading & scalping IC Markets
Shadow Trader
Posts: 5438
Joined: Wed Sep 09, 2026 5:19 pm

Re: Fibonacci Clusters From Multiple Swings: Testing Confluence Objectively

Post by Shadow Trader »

I've tested something close to this on EURUSD, and the result was more modest than the cluster idea suggests. The attached chart is an illustration of how I set it up: retracements from two swings, with the 61.8% of one and the 50% of the other landing within 2 pips of each other at 1.0842.
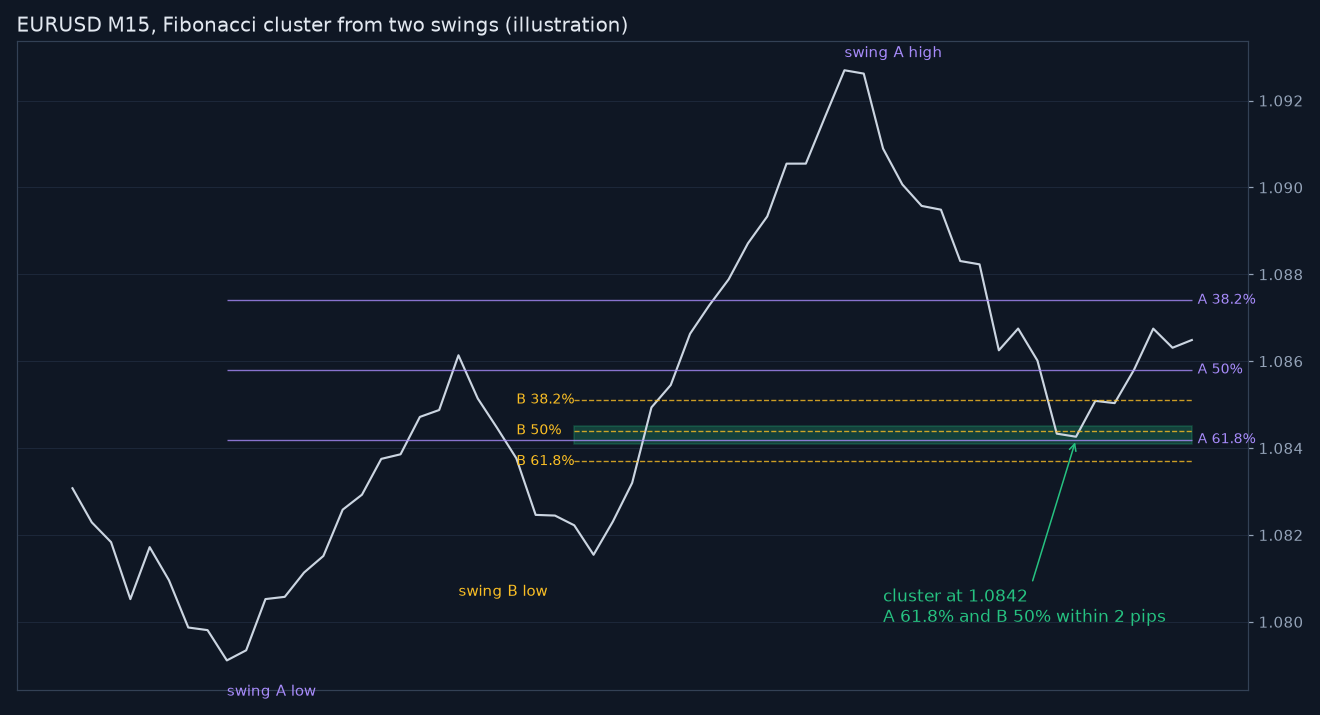
img_13450.png
img_13450.png (81.31 KiB) Viewed 121 times
Over about 120 cluster zones on M15, price reacted by at least 8 pips in 41% of cases. My random levels, picked within the same swing range, reacted in 33%. So there was an edge, but smaller than my memory had suggested.

The bigger difference was when the cluster also lined up with a prior swing high or low. Those reacted far more often, which makes me think the structure was doing most of the work and the fib was just pointing at it.

Your 0.2 times ATR tolerance seems right to me. Wider than that and almost everything becomes a cluster.

How do you define a reaction? I used 8 pips without first moving 5 pips through the zone.

Fairman
Posts: 6802
Joined: Tue Jul 21, 2026 7:11 am
Location: Abuja

Re: Fibonacci Clusters From Multiple Swings: Testing Confluence Objectively

Post by Fairman »

FXS Prop Desk wrote: Compare reactions at cluster zones with reactions at random levels.
The detail that makes or breaks that comparison is how the random levels are chosen. If they're spread evenly across the chart, many will sit far from current price where price never reaches them, while fib clusters always sit inside the recent swing, close to where price is trading. Clusters then look better just because price visits them more. A fairer control is random levels drawn from the same zone, say anywhere between the swing high and low, with the same zone width as your clusters. Then measure the same thing for both, for example the share of touches that reverse by at least 1 ATR before going 0.5 ATR through. If the clusters still win against that, it's a real result.
It’s Fairman :geek:
Shadow Trader
Posts: 5438
Joined: Wed Sep 09, 2026 5:19 pm

Re: Fibonacci Clusters From Multiple Swings: Testing Confluence Objectively

Post by Shadow Trader »

Fairman's point about the control levels made me recheck my own test, and it found a flaw. My random levels were single prices, while my clusters were zones up to 2 pips wide, so the clusters got touched more often just by being wider.

I rebuilt the control as random 2 pip zones drawn between the same swing high and low, and used the measure suggested above. Clusters then reversed 1 ATR before going 0.5 ATR through on 30% of touches, and the random zones on 25%.

That is still a difference, but the sample is now the bigger issue. With about 120 touches each, the error on the gap between two such rates is around six points, so a five point difference is within the noise.

I'm going to run it on two more pairs before I believe it. If the edge is real it should show up on GBPUSD and USDJPY without changing the tolerance or the swing rules.

Has anyone here pooled enough touches to get past a few hundred? Below that I think most cluster results, mine included, are anecdotes with decimals.
Shadow Trader
Posts: 5438
Joined: Wed Sep 09, 2026 5:19 pm

Re: Fibonacci Clusters From Multiple Swings: Testing Confluence Objectively

Post by Shadow Trader »

Fibonacci levels, 38.2%, 50% and 61.8%, are among the most widely drawn tools in trading. On a one-minute chart, with swings of five to twenty pips, the retracement levels fall within a few pips of each other, and price crosses plenty of lines all the time.

That creates an obvious problem. If there are enough lines on the chart, price will always react near one of them. Confirmation bias does the rest, remembering the bounces and forgetting the breaks.

A test needs fixed rules: which swing counts, how the levels are drawn, what constitutes a reaction, and what the trade rules are. Then compare against random levels placed between the same swing points. If the Fibonacci levels perform no better than random fractions of the swing, there's no special magic.

Studies on this in various markets have generally found weak or inconsistent evidence, though a self-fulfilling element may exist where many participants watch the same levels.

Another way to examine confluence is counting how many Fibonacci levels from different swings cluster at the same price. Two levels within a pip of each other form a "confluence zone", which some traders favour. With a few swings on the chart, such clusters appear nearly everywhere, so a random-level control is essential.

When tests do show a small edge, it usually comes from the 50% and 61.8% retracements in trending markets, and it's small enough that costs can erase it on short timeframes.

Has a proper comparison against random retracement levels ever been run, and what came out?
FXS Prop Desk
Posts: 1578
Joined: Wed Oct 07, 2026 9:52 am

Re: Fibonacci Clusters From Multiple Swings: Testing Confluence Objectively

Post by FXS Prop Desk »

Fairman wrote: A fairer control is random levels drawn from the same zone
Drawing the control from inside the same swing is the fair version. Two more details: match the number of random levels to the number of clusters per swing, otherwise one side simply gets more chances to be touched, and repeat the random draw a few hundred times. The cluster result can then be read as a percentile of the control distribution rather than one comparison that might be luck.
FXS Official Team | The Idea Lab & Strategy
Fairman
Posts: 6802
Joined: Tue Jul 21, 2026 7:11 am
Location: Abuja

Re: Fibonacci Clusters From Multiple Swings: Testing Confluence Objectively

Post by Fairman »

Matching the number and width of control zones to the cluster zones is an important improvement; otherwise the comparison gives one side more chances to be touched. Repeating the random draw also helps show whether the observed cluster result is unusual relative to that particular control design, rather than a lucky single draw. I would make the randomization respect the same swing boundaries, time period, and eligibility rules used to generate clusters, and keep the reaction definition fixed throughout.

One remaining issue is dependence. Several candidate levels can come from the same swing or the same market episode, so a few hundred simulated placements do not create a few hundred independent market observations. I would report the actual number of distinct swings or sessions as well as touches, and use a resampling approach that keeps related observations together. It is also worth separating discovery from confirmation: if the tolerance, swing rule, or outcome horizon was adjusted after seeing results, evaluate the final rule on new data. A percentile against the random-zone distribution is a useful diagnostic, but it is not automatically a probability that the pattern will work live. Net performance after spread and execution assumptions is the practical final check.
It’s Fairman :geek:
Post Reply

