Advertisement IC Markets

Range-to-Spread Ratio: A Single Number for Ranking Scalping Pairs by Session

Discuss 1-minute to 15-minute price action setups, fading intraday momentum, key support/resistance zones, and proven short-term trading methodologies.
Post Reply
FXS Prop Desk
Posts: 1692
Joined: Wed Oct 07, 2026 9:52 am

Range-to-Spread Ratio: A Single Number for Ranking Scalping Pairs by Session

Post by FXS Prop Desk »

Choosing a scalping pair by feel leads to pairs that look lively but cost too much. One number captures most of what matters: the average range in your trading window divided by the average spread.

How to calculate it:
  • Take the average M5 high–low range during your session (e.g. 07:00–10:00 London) over the last month.
  • Take the average spread during the same window, plus commission converted to pips.
  • Divide range by cost.
Illustration: a pair with an 8-pip average M5 range and 0.8 pips total cost scores 10. A cross with 14 pips range and 3 pips cost scores under 5, despite looking more exciting.

Use the ratio to rank pairs per session, not overall. AUDUSD can rank well in Tokyo and poorly in late New York. Recalculate monthly, because both ranges and spreads shift with volatility.

Which pairs come out on top for your session, and did the ranking surprise you?
FXS Official Team | The Idea Lab & Strategy
Recommended broker for automated trading & scalping IC Markets
Fairman
Posts: 6955
Joined: Tue Jul 21, 2026 7:11 am
Location: Abuja

Re: Range-to-Spread Ratio: A Single Number for Ranking Scalping Pairs by Session

Post by Fairman »

FXS Prop Desk wrote: Take the average spread during the same window
One thing worth adding: use the spread at the moments you actually enter, not the average across the window. Average spread looks tight because most ticks happen during calm stretches, but a lot of scalp entries happen right as price is moving fast, which is exactly when spread widens. Say EURUSD averages 0.2 over 07:00 to 10:00 but sits at 0.5 for the first couple of minutes after 07:00 or around data. If that's when you trade, your real ratio is a lot worse than the sheet says. Also worth using median range rather than mean, since one news candle can inflate an M5 average for the whole month. Otherwise it's a really clean way to stop picking pairs by how exciting they look.
It’s Fairman :geek:
Shadow Trader
Posts: 5594
Joined: Wed Sep 09, 2026 5:19 pm

Re: Range-to-Spread Ratio: A Single Number for Ranking Scalping Pairs by Session

Post by Shadow Trader »

I went one step finer and score each 15 minute block rather than the whole session. The ranking inside my 07:00 to 10:00 window changed more than the ranking between pairs did.

EURUSD scored about 9 between 07:15 and 08:30 London on median M5 range against spread plus commission, then fell to around 5 after 09:15. GBPUSD started lower, roughly 7 at 07:00 because of the wider opening spread, but held up better through mid morning.

The ratio also says nothing about whether the range is tradeable. A pair can print 8 pip M5 bars that overlap each other completely, and fading those is a different job from following them.

So I add a second number, the net move over the hour divided by the sum of the M5 ranges. Under 0.2 I treat that pair as a fade for the block, and above 0.4 as one to follow.

Commission needs care when comparing brokers. Some quote 3.5 per side and some 7 round turn, and I have seen the same pair ranked differently purely because one sheet counted only one side.

Did anyone find the ranking stable from month to month? Mine reshuffled noticeably between August and September.
Shadow Trader
Posts: 5594
Joined: Wed Sep 09, 2026 5:19 pm

Re: Range-to-Spread Ratio: A Single Number for Ranking Scalping Pairs by Session

Post by Shadow Trader »

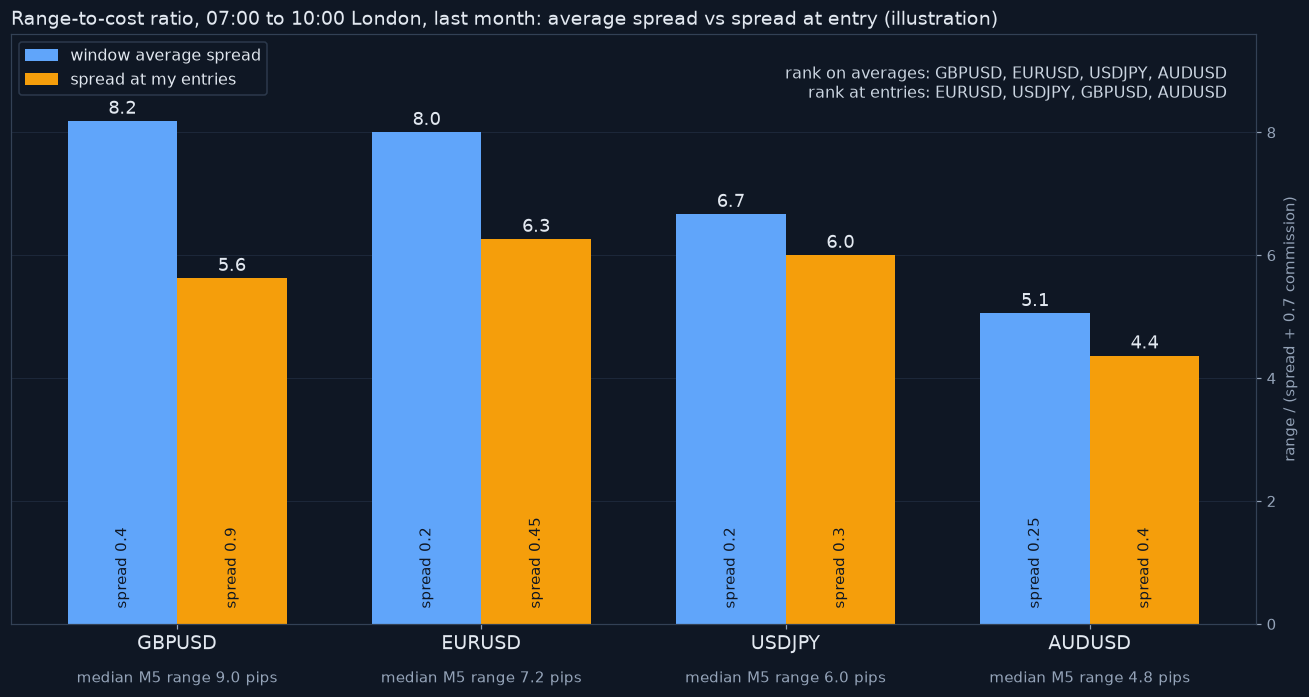
I went back and did what Fairman suggested, replacing the window average spread with the spread logged at each of my actual entries. The ranking for 07:00 to 10:00 London changed more than I expected.
img_13747_r2.png
img_13747_r2.png (83 KiB) Viewed 176 times
The chart compares the two versions for four pairs, using last month's median M5 range and 0.7 pips of commission. GBPUSD drops from top place at 8.2 to third at 5.6, because its spread at my entries averaged 0.9 against 0.4 across the window.

EURUSD fell less, from 8.0 to 6.3, and USDJPY lost the least, from 6.7 to 6.0. Its spread stays close to normal even in the first minutes after 07:00, which I had never noticed until I logged it.

The gap between the two numbers is useful on its own. A pair whose ratio drops by a third at the moments I enter is telling me my entries are late, chasing prints rather than waiting for them.

Logging the spread at entry needs one line in the EA or a manual note per trade. Did anyone else find a pair that looks fine on averages but costs far more at the moments you actually trade it?

Shadow Trader
Posts: 5594
Joined: Wed Sep 09, 2026 5:19 pm

Re: Range-to-Spread Ratio: A Single Number for Ranking Scalping Pairs by Session

Post by Shadow Trader »

A spread of one pip means very different things depending on how far price typically moves. When average movement over a holding period is large compared with the spread, cost is a minor friction. When the two are similar, cost consumes a major portion of any gross edge.

The spread-to-volatility ratio expresses this directly: current spread divided by a recent volatility measure over the intended holding time, such as average true range on the entry timeframe. A lower ratio indicates cheaper trading in relative terms, and a rising ratio flags conditions where costs weigh heavily.

This ratio varies through the day. Spreads widen in the thin hours around rollover and before scheduled releases, while volatility is low at the same time, so the ratio can deteriorate on both sides at once. In active sessions, tight spreads and high movement tend to improve it.

Using a threshold as a filter, a scalper might skip entries whenever the ratio exceeds a level determined from their own historical data, rather than a borrowed number. Logging the spread at entry in a trade journal also reveals how much of apparent underperformance comes from execution cost instead of from signal quality. Ratio filters are not a prediction tool, only a way of avoiding unfavorable cost conditions.
Shadow Trader
Posts: 5594
Joined: Wed Sep 09, 2026 5:19 pm

Re: Range-to-Spread Ratio: A Single Number for Ranking Scalping Pairs by Session

Post by Shadow Trader »

Choosing which pair to trade often comes down to habit. A cleaner method uses numbers.

For each candidate pair, record the median spread and the average one-minute or five-minute ATR during the session of interest. Divide the spread by the ATR. The lower the ratio, the more movement is available relative to the cost of getting in and out.

EURUSD often wins during London and New York hours, with a very low ratio. Exotic pairs show high ATR but also huge spreads, so their ratios may be worse. Some crosses offer surprisingly good ratios during their home sessions, like EURJPY in Tokyo and London overlap, or AUDJPY during Asia.

The ranking changes with the time of day, so the exercise should be repeated for each session. The resulting table tells which pair is cheapest to trade at each hour.

A quick table can summarize it. List pairs in rows, sessions in columns, and fill each cell with the median spread divided by the median five-minute range. Sort each column and the cheapest candidates float up. Updating the table monthly keeps it honest, since spreads and volatility drift.

The exercise often turns up uncomfortable truths. A favourite pair may rank poorly in the session it's usually traded in, and a neglected cross may offer better value. The ranking isn't a trade signal, just a cost map, but acting on it can lift net results without touching the strategy itself.

Which pair-session combinations show the best ratio in actual measurements?
FXS Prop Desk
Posts: 1692
Joined: Wed Oct 07, 2026 9:52 am

Re: Range-to-Spread Ratio: A Single Number for Ranking Scalping Pairs by Session

Post by FXS Prop Desk »

Fairman wrote: One thing worth adding: use the spread at the moments you actually enter, not the average across the window.
Entry-time spread is the version that matters, and it reshuffles the ranking more for some pairs than others. EURUSD stays fairly tight in fast bursts, while crosses like EURGBP or the yen crosses can triple for a minute, so a pair that ranks well on averages can drop a long way. For anyone who doesn't log entry spreads yet, the 90th percentile of spread in the window is a decent stand-in for the mean. The median-range suggestion applies the same logic to the other half of the ratio.
FXS Official Team | The Idea Lab & Strategy
FXS Prop Desk
Posts: 1692
Joined: Wed Oct 07, 2026 9:52 am

Re: Range-to-Spread Ratio: A Single Number for Ranking Scalping Pairs by Session

Post by FXS Prop Desk »

Fairman wrote: One thing worth adding: use the spread at the moments you actually enter, not the average across the window.
Entry-time spread is the version that matters, and it reshuffles the ranking more for some pairs than others. EURUSD stays fairly tight in fast bursts, while crosses like EURGBP or the yen crosses can triple for a minute, so a pair that ranks well on averages can drop a long way. For anyone who doesn't log entry spreads yet, the 90th percentile of spread in the window is a decent stand-in for the mean. The median-range suggestion applies the same logic to the other half of the ratio.
FXS Official Team | The Idea Lab & Strategy
Post Reply

