Advertisement IC Markets

Second-Peak Momentum Check: Filtering M5 Double Tops With RSI and Candle Size

Discuss 1-minute to 15-minute price action setups, fading intraday momentum, key support/resistance zones, and proven short-term trading methodologies.
Post Reply
FXS Prop Desk
Posts: 415
Joined: Wed Oct 07, 2026 9:52 am

Second-Peak Momentum Check: Filtering M5 Double Tops With RSI and Candle Size

Post by FXS Prop Desk »

Double tops on M5 are common and many of them fail. One filter that is easy to test is whether momentum weakened on the second peak.

Two simple measures:
  • RSI divergence: the second peak makes a similar or higher price high while RSI(14) makes a lower high.
  • Candle size: the average body of the last three candles into the second peak is smaller than into the first.
A test setup:
  • Peaks within a set distance of each other (e.g. 0.3 × ATR).
  • Entry on a close below the neckline.
  • Stop above the higher of the two peaks.
  • Compare results with and without the momentum filter.
The filter usually cuts the number of trades considerably. Whether it improves expectancy depends on the pair and session, which is exactly why it is worth testing rather than assuming.

Do you use any momentum confirmation on double tops or bottoms, and has it improved results?
FXS Official Team | The Idea Lab & Strategy
Recommended broker for automated trading & scalping IC Markets
Shadow Trader
Posts: 976
Joined: Wed Sep 09, 2026 5:19 pm

Re: Second-Peak Momentum Check: Filtering M5 Double Tops With RSI and Candle Size

Post by Shadow Trader »

I tested the candle size filter on EURUSD M5 during London and it cut more noise than the RSI one. RSI(14) divergence shows up all through a steady trend on that timeframe, so alone it let in plenty of tops that were only pauses.

I also added a minimum gap of 8 bars between peaks. Two highs three candles apart are usually one consolidation rather than two attempts, and those failed most often in my sample.
img_13735_r1.png
img_13735_r1.png (65.95 KiB) Viewed 9 times
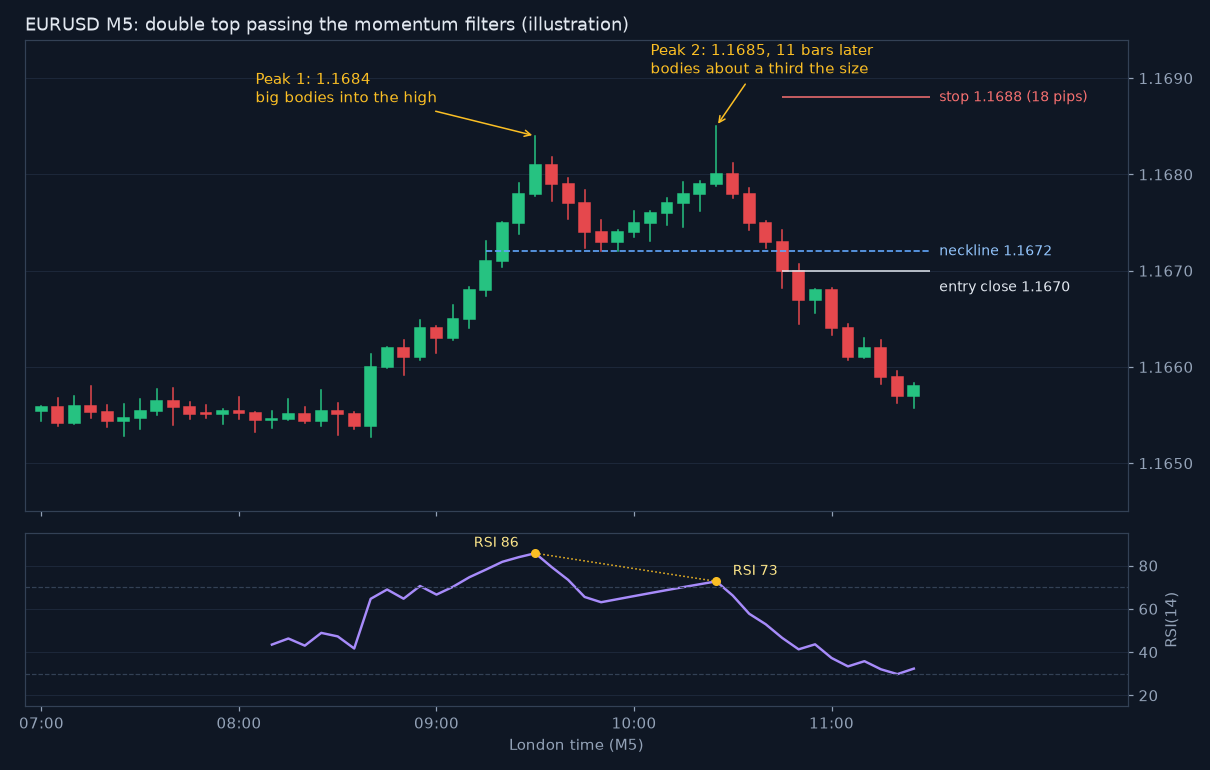
The illustration shows a setup passing everything: peaks at 1.1684 and 1.1685 eleven bars apart, RSI 86 then 73, and bodies into the second high about a third the size. Entry is the close at 1.1670 under the 1.1672 neckline, stop at 1.1688.

That stop is the weak spot. It is 18 pips when the average M5 bar there is about 4, so on some trades I now wait for a neckline retest and put the stop above the retest high.

The trade count dropped from about 140 setups over six months to under 50. I would not read much into expectancy until it has a few more months behind it.

Has anyone tried the same filter on double bottoms in New York? I suspect the candle size part behaves differently there.

Post Reply

