FXS Prop Desk, I measured the half the charts test properly, because the scratch rate alone did not explain much. I logged four weeks per layout and graded every ticket A or B against my written setup before the outcome was known.
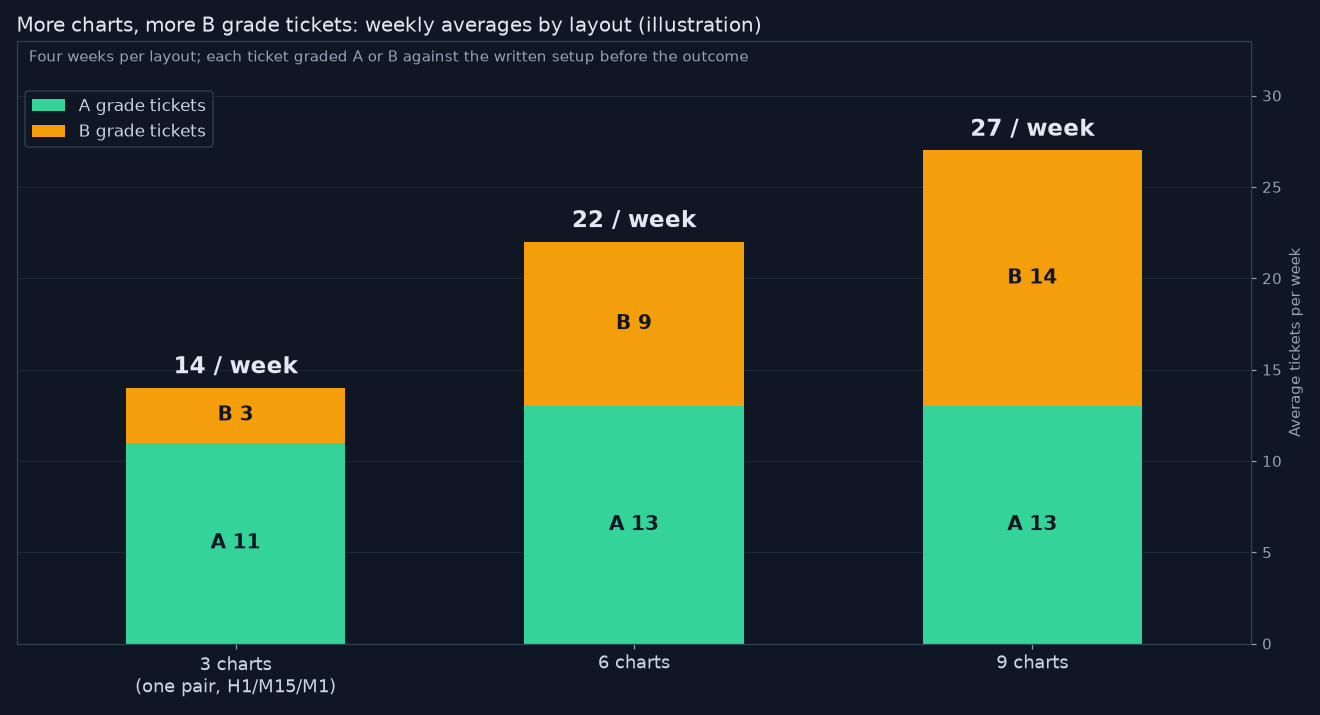
With 3 charts on one pair I averaged 14 tickets a week, and 3 of them were B grade. At 6 charts that went to 22 tickets with 9 B grade, and at 9 charts it was 27 tickets with 14 B grade.
- img_13605_r2.png (60.88 KiB) Viewed 7 times
The illustration stacks those weekly averages, A grade in green and B grade in amber. More screens mostly added B tickets, while the A count only moved from 11 to 13.
One rule came out of it: any chart I have not acted on in two weeks gets closed. Most of the extras survived on the feeling that I might need them one day.
Alerts are my compromise for the pairs I dropped. A price alert at a level costs no screen space and no attention until it fires.
Do you count alert driven pairs as part of the layout, or only what sits on screen? I am unsure whether alerts sneak the noise back in.


