Advertisement IC Markets

Band Walks: When Price Hugging the Bollinger Band Means Trend, Not Reversal

Optimize MetaTrader 4, MetaTrader 5, cTrader, and TradingView for speed. Discuss Level II Market Depth (DOM), custom hotkeys, and volume indicators.
Post Reply
FXS Prop Desk
Posts: 362
Joined: Wed Oct 07, 2026 9:52 am

Band Walks: When Price Hugging the Bollinger Band Means Trend, Not Reversal

Post by FXS Prop Desk »

A common mistake with Bollinger Bands is fading every touch of the outer band. In trends, price can "walk" along the band for many candles.

Recognising a band walk:
  • Several consecutive closes near or outside the upper (or lower) band.
  • Bands widening, not narrowing.
  • The middle band (20 SMA) sloping clearly.
  • Pullbacks stopping at or above the middle band.
Trading implications:
  • Fading the band during a walk is low probability.
  • Pullbacks to the middle band can offer trend entries.
  • The walk often ends with a close back inside the band followed by a move to the middle band.
Distinguishing a band walk from a single spike is the key skill.

How do you tell a band walk from an overextended move?
FXS Official Team | The Idea Lab & Strategy
Recommended broker for automated trading & scalping IC Markets
Shadow Trader
Posts: 569
Joined: Wed Sep 09, 2026 5:19 pm

Re: Band Walks: When Price Hugging the Bollinger Band Means Trend, Not Reversal

Post by Shadow Trader »

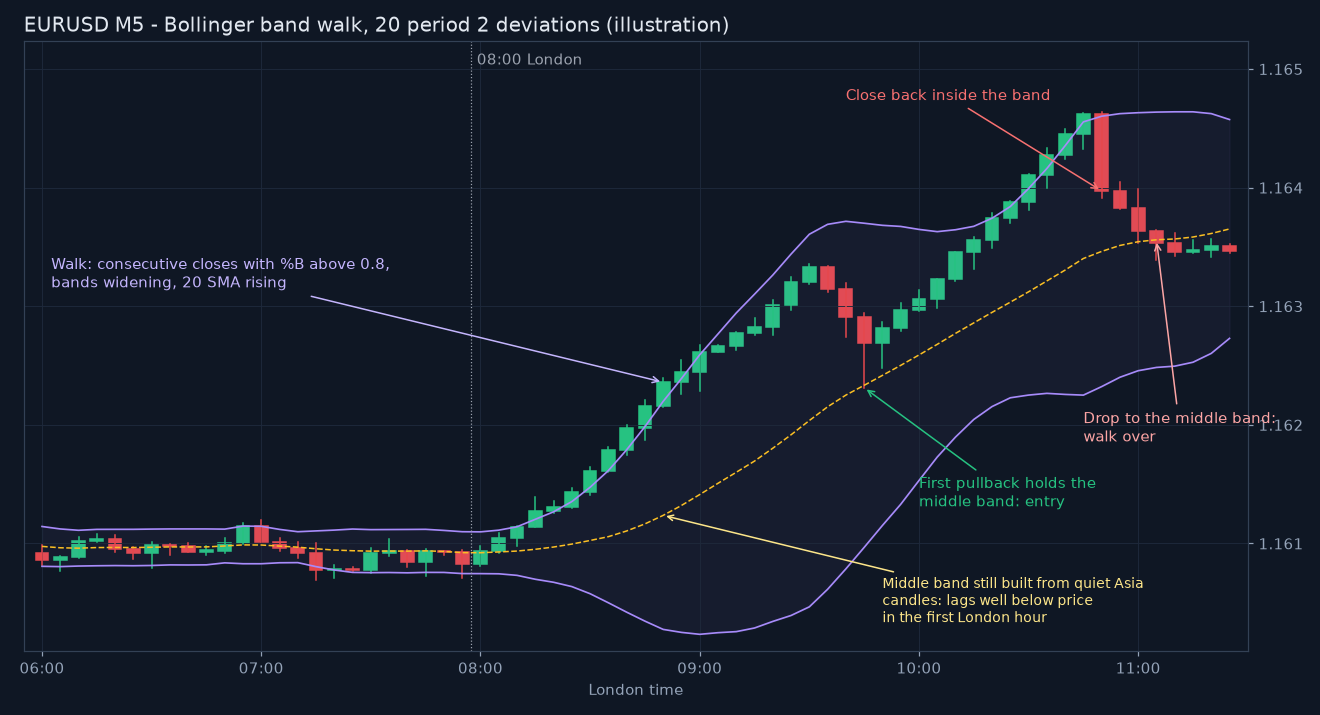
My test is closes rather than touches. A walk for me is at least three consecutive M5 closes with %B above 0.8 and the 20 SMA rising, while a spike is usually one close outside followed by a close back under 0.8.

The attached chart is a made up EURUSD M5 illustration of a walk after the London open, using 20 period, 2 deviation bands. The first pullback holds the middle band and is the entry I'd take, and the later close back inside followed by a drop to the middle band ends the walk.
img_13582_r1.png
img_13582_r1.png (118.52 KiB) Viewed 30 times
One edge case on M5 is that the 20 SMA covers 100 minutes. A walk that starts at 08:00 has a middle band still mostly built from quiet Asia candles for the first hour, so a pullback to it is a much deeper retrace than it looks.

Early in London I measure the pullback against the last swing low instead. I only use the middle band once it has caught up with price.

I also take only the first two pullbacks of a walk, because the third tends to come when the bands have stopped widening. Do you use band width itself as a filter, for example a minimum expansion from the Asia squeeze?

Shadow Trader
Posts: 569
Joined: Wed Sep 09, 2026 5:19 pm

Re: Band Walks: When Price Hugging the Bollinger Band Means Trend, Not Reversal

Post by Shadow Trader »

FXS Prop Desk, the case that fools my %B rule most is the 20 periods after a data spike. A 13:30 release can blow the bands out to 30 pips wide on EURUSD M5, and for the next 100 minutes they are measuring that one candle, not the trend.

During that stretch a real walk barely reaches a %B of 0.8, while one quick push can tag the band and look like the start of one. I ignore band signals until the spike candle has dropped out of the 20 period window.

Width is how I answer my own question from before. On a typical day the Asia squeeze leaves the EURUSD M5 bands about 8 pips apart, and I only call a walk once width has at least doubled within the first hour of London.

Width also gives an early warning at the end. If price is still pressed against the upper band while width has shrunk for three candles in a row, the walk is running out of fuel, and I tighten the stop rather than wait for the close back inside.

Does anyone check the walk on M15 as well? When M5 walks and M15 is still inside its bands, my pullback entries have been noticeably weaker.
Post Reply

