Page 1 of 1
Expectancy: The One Number That Summarises a Strategy
Posted: Thu Oct 08, 2026 8:16 pm
by FXS Prop Desk
Expectancy shows how much a strategy makes per trade on average:
Code: Select all
E = (win% × avg win) − (loss% × avg loss)
Example: 55% wins with average +8 pips, 45% losses with average −7 pips → E = 4.4 − 3.15 = +1.25 pips per trade.
Why it matters:
- It combines win rate and R:R in one number.
- Subtract costs: if your average cost per trade is 1 pip, the real expectancy is +0.25 pips.
- Divide by average risk to get expectancy in R, which makes strategies comparable.
For scalping, expectancy after costs is often much smaller than before costs. That is why execution quality matters so much.
What is your strategy's expectancy after costs, and how many trades did you use to measure it?
Re: Expectancy: The One Number That Summarises a Strategy
Posted: Mon Oct 12, 2026 10:02 am
by Fairman
FXS Prop Desk wrote: Subtract costs: if your average cost per trade is 1 pip, the real expectancy is +0.25 pips.
Worth adding that costs also shift the win rate, not just the average. Trades that would have closed at +0.5 pips gross become losers net of a 1 pip cost, so subtracting a flat 1 pip is right in total but leaves the win rate and average figures looking better than they are. Recalculating on net results per trade keeps the numbers honest. On how many trades, the uncertainty around expectancy shrinks with the square root of the count. Say the standard deviation per trade is 9 pips. With 100 trades the standard error is about 0.9 pips, far bigger than a +0.25 edge, and you'd need several thousand trades before +0.25 is clearly distinguishable from zero.
Re: Expectancy: The One Number That Summarises a Strategy
Posted: Fri Oct 16, 2026 1:04 pm
by Shadow Trader
Fairman is right that costs change the win rate, not only the average. When I recompute my main EURUSD scalp on net fills, win rate drops about 4 points and average win shrinks, so the pretty +1.2 pip gross expectancy collapses to roughly +0.3 after spread and commission.
I measure on rolling blocks of 200 trades rather than a lifetime dump. That keeps a regime change visible instead of burying a bad quarter inside an old edge.
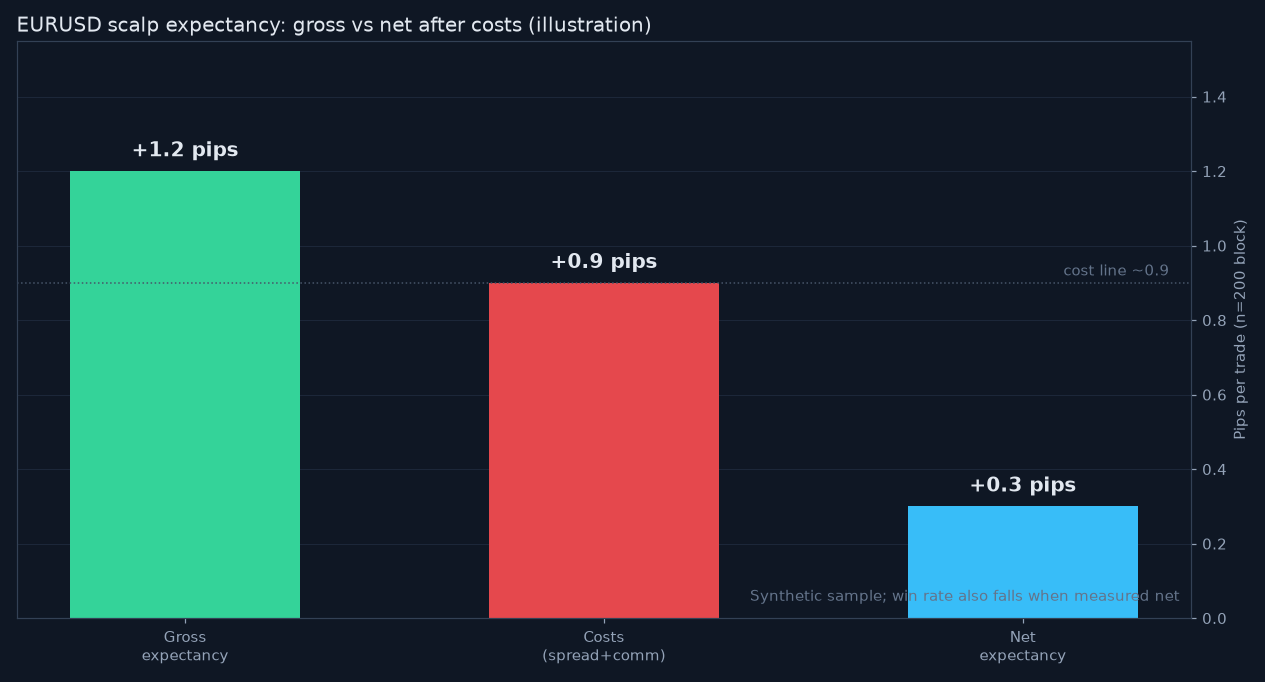
- img_13688_r1.png (51.1 KiB) Viewed 10 times
The illustration shows gross versus net expectancy on the same 200 trade block, with the cost line marked. Once costs sit near the gross edge, the strategy is basically a coin flip with fees.
Sample size still bites. With a per trade standard deviation around 8 pips, a few hundred trades leave a wide band around that +0.3, so I treat it as a go or no go filter rather than a precise forecast.
Do you publish expectancy to yourself in R or in pips? I switched to R last year so different pairs stay comparable after the pip value changes.