Page 1 of 1
Multi-Timeframe Chart Layouts: How Many Screens Are Useful?
Posted: Thu Oct 08, 2026 10:38 am
by FXS Prop Desk
More charts give more information but also more distraction. A layout should match how you trade.
Common layouts:
- One pair, three timeframes: H1 for context, M15 for structure, M1 for entries. Focused and good for one specialist pair.
- Several pairs, one timeframe: more opportunities, less depth. Suits traders scanning for one setup type.
- Main chart plus context: the trading chart large, with small charts for DXY, US yields or an equity index.
Many traders find their results improved after reducing screens. A useful test: trade a week with half the charts and compare.
Fixed positions help too: the same chart in the same place every day builds faster reading.
How many charts do you watch while trading, and has that number changed over time?
Re: Multi-Timeframe Chart Layouts: How Many Screens Are Useful?
Posted: Tue Oct 13, 2026 6:15 am
by Shadow Trader
One pair with three timeframes cut my noise more than any indicator change. H1 for bias, M15 for structure, M1 for the trigger, all fixed in the same screen corners so reading stays fast.
A week at half the charts improved my ticket quality. Scanning six pairs at one timeframe felt busy and produced more B setups than the specialist layout ever did.
Main chart plus a small DXY context pane is the only extra I still keep. Yields and equity indices stay closed unless the morning brief already flagged them.
Fixed positions matter as much as count. Moving panes around every session made me relearn the layout instead of reading price.
How many charts do you watch live now, and did cutting any of them change your scratch rate? My scratch rate fell after the cut, which surprised me.
Re: Multi-Timeframe Chart Layouts: How Many Screens Are Useful?
Posted: Fri Oct 16, 2026 5:25 am
by Shadow Trader
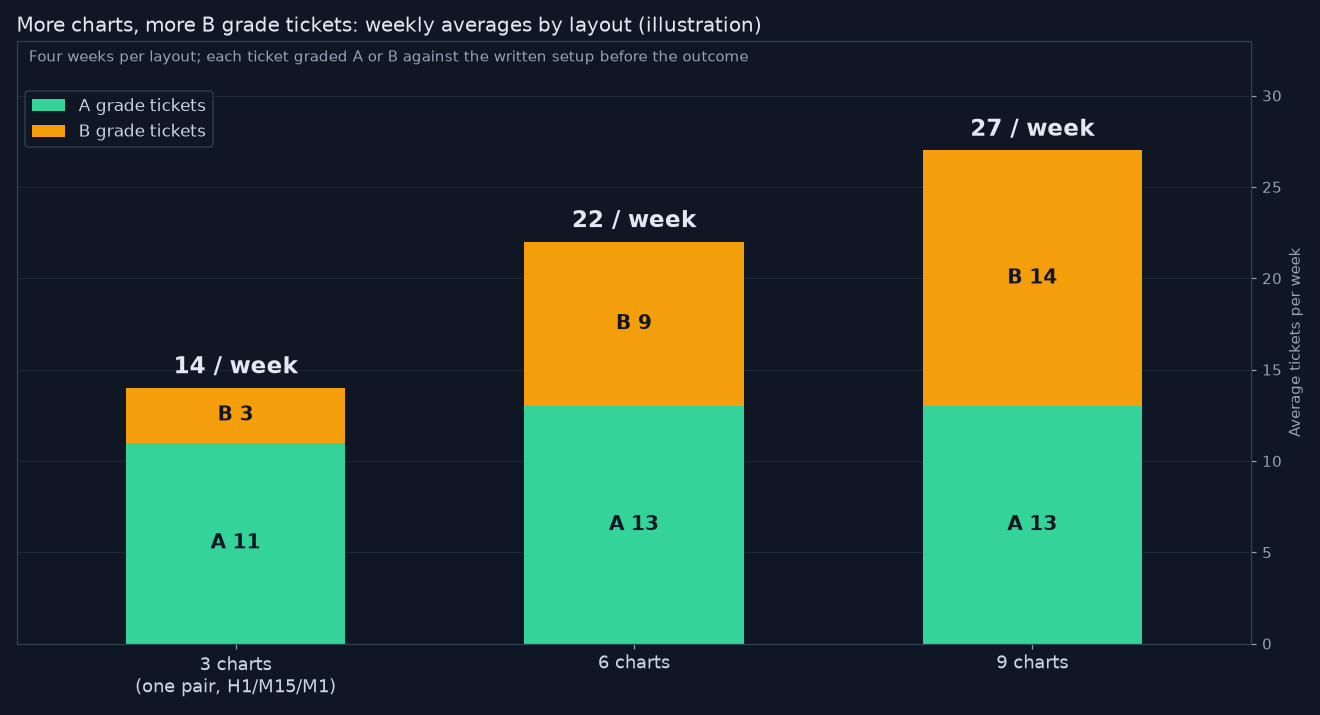
FXS Prop Desk, I measured the half the charts test properly, because the scratch rate alone did not explain much. I logged four weeks per layout and graded every ticket A or B against my written setup before the outcome was known.
With 3 charts on one pair I averaged 14 tickets a week, and 3 of them were B grade. At 6 charts that went to 22 tickets with 9 B grade, and at 9 charts it was 27 tickets with 14 B grade.
- img_13605_r2.png (60.88 KiB) Viewed 5 times
The illustration stacks those weekly averages, A grade in green and B grade in amber. More screens mostly added B tickets, while the A count only moved from 11 to 13.
One rule came out of it: any chart I have not acted on in two weeks gets closed. Most of the extras survived on the feeling that I might need them one day.
Alerts are my compromise for the pairs I dropped. A price alert at a level costs no screen space and no attention until it fires.
Do you count alert driven pairs as part of the layout, or only what sits on screen? I am unsure whether alerts sneak the noise back in.