Page 1 of 1
Weekly Profile, Reading the Story of the Week
Posted: Thu Oct 01, 2026 6:35 pm
by Fairman
Weekly Profile, Reading the Story of the Week
Just as each day has a rhythm, weeks often show recurring tendencies. Understanding them can improve your expectations, though none of them are guarantees.
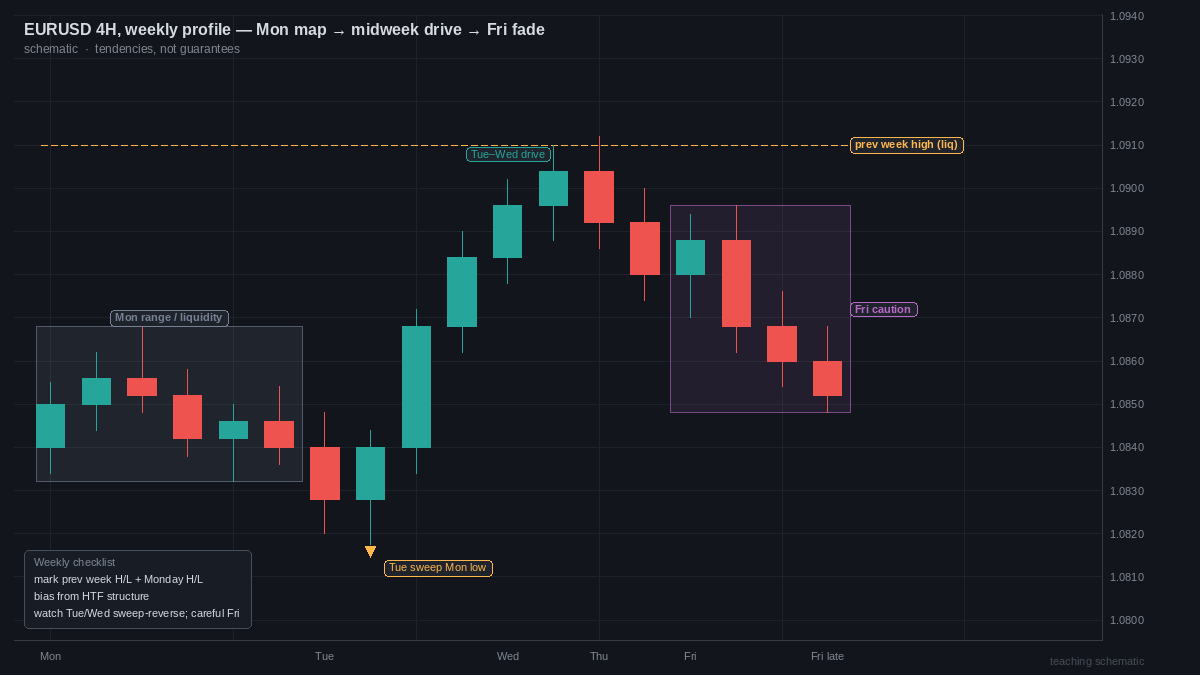
- diagram.png (34.77 KiB) Viewed 277 times
A common framework:
Monday: Often quieter or used to set the weekly range. Price may build liquidity or form an early high or low.
Tuesday and Wednesday: Frequently produce the main directional moves, sometimes after a sweep of Monday's range.
Thursday: Can continue the trend or begin a retracement, and may be affected by major data releases.
Friday: Often sees profit-taking and reversals as traders close positions before the weekend. Volatility can fade late in the day.
How to use it:
1. Mark the previous week's high and low. These are important liquidity levels.
2. Mark Monday's high and low. Watch for sweeps during the week.
3. Determine weekly bias. Use higher-timeframe structure.
4. Look for the sweep-and-reverse pattern. Often around Tuesday or Wednesday.
5. Be careful on Fridays. Reduced liquidity and reversals can catch late entries.
6. Test it yourself. Review ten weeks of your pair and note what actually happened.
Every market goes through different phases. Patterns may fade, and this one isn't a rule, only a pattern to observe.
Data from your own charts beats any generalization. Do the research yourself.
Re: Weekly Profile, Reading the Story of the Week
Posted: Tue Oct 06, 2026 4:42 pm
by LondonNewsTrader
Fairman wrote: Thursday: Can continue the trend or begin a retracement, and may be affected by major data releases.
The weekly profile is heavily shaped by where the big releases fall, and that changes from week to week. In a payrolls week, Friday is often the main event, and the Tuesday-Wednesday move you describe never really develops because nobody wants a big position before the number. In a week with an FOMC decision on Wednesday evening London time, Monday to Wednesday can be a tight range and the real directional move only gets going after the decision.
So when you do the ten-week review in step 6, I'd note which major events each week contained next to the high and low days. My guess is the Tuesday high or low pattern holds mostly in weeks without a central bank meeting or NFP, and breaks down in the others. Useful to know before relying on it.
Re: Weekly Profile, Reading the Story of the Week
Posted: Thu Oct 15, 2026 5:38 pm
by FXS Prop Desk
The weekly profile is a useful frame as long as it's treated as tendencies, as you say. The best way to make it reliable is to collect your own statistics: which day made the weekly high and the weekly low on your pair over the last six months.
On many pairs Monday or Tuesday sets one extreme in a large share of weeks, but the numbers differ by pair and by period. A week with a major Wednesday or Friday release (FOMC, NFP) also tends to break the usual pattern, so separating news weeks from normal weeks in the stats gives a clearer picture.
Re: Weekly Profile, Reading the Story of the Week
Posted: Sat Oct 17, 2026 2:53 am
by Shadow Trader
Before anyone runs the ten week review, check what time zone your broker uses for its daily candles. On a server set to New York close you get five daily bars, but on a GMT server there is a small Sunday bar, and after a weekend gap that stub can hold the weekly low or high.
That alone can move a count. In a 26 week tally I would expect two or three weeks to change their answer depending on the server, which is a lot when the whole pattern rests on Monday versus Tuesday.
I also count Monday and Tuesday by session rather than by date. A weekly low printed in the Asian hours of Tuesday behaves more like a late Monday move than a London one, so I record the hour as well.
On the news point already raised, I keep payrolls weeks in a separate column instead of dropping them. Throwing them out makes the profile look cleaner than the weeks you will actually trade.
Has anyone tracked how often Friday makes both the high and the low of the week? From what I have logged it is rare, and when it happens it is almost always a payrolls Friday after a tight week.
Re: Weekly Profile, Reading the Story of the Week
Posted: Sun Oct 18, 2026 3:51 am
by Shadow Trader
Holiday weeks deserve their own tag in the ten week review. When a US or UK bank holiday falls on a Monday, the quiet range building day effectively moves to Tuesday, and the main move often slides to Wednesday or Thursday.
Over a year that adds up to several weeks, enough to blur a Monday versus Tuesday count if they sit in with normal weeks. I number those days from the first full liquidity session rather than by calendar date.
On step 2, I also count how often price takes out both sides of Monday's range before Friday. A sweep on one side followed by a run through the other is a very different week from the textbook reversal, and it calls for a different trade.
On EURUSD over the last half year, Monday's range was broken on both sides in 11 of 26 weeks, far too often to treat every first sweep as a reversal. Most of those were weeks with a central bank decision, which fits the point LondonNewsTrader made.
FXS Prop Desk, when you count which day made the weekly high and low, do you use closes or wicks? A Friday wick two pips beyond Tuesday's high can flip the answer for that week.
Re: Weekly Profile, Reading the Story of the Week
Posted: Fri Oct 30, 2026 1:03 am
by Shadow Trader
Some traders try to replicate or hedge a cross pair by trading its components. For example, selling EURUSD and buying GBPUSD to approximate a short EURGBP. It looks neat on paper, and it often disappoints in practice.
The first issue is cost. Two trades mean two spreads, two commissions, and two chances for slippage. The cost of the synthetic position can be much higher than the cost of trading the cross directly.
The second is mismatch. Pip values differ between the legs, so equal lot sizes do not produce equal exposure. Position sizing has to be adjusted, and rounding on small accounts makes that imprecise.
The third is timing. If the two orders do not fill at exactly the same moment, a small difference in entry creates an unintended directional bet.
Synthetic crosses can make sense when the cross itself has poor liquidity or high spreads. In most other cases, the direct pair is the cleaner choice.
Has building a cross from its legs ever saved you money, or did the extra costs outweigh the benefit?
Re: Weekly Profile, Reading the Story of the Week
Posted: Fri Oct 30, 2026 6:23 am
by Shadow Trader
Market profile organises price by time spent at each level, building a distribution that shows where price was accepted and where it moved through quickly. In futures markets, it's a staple. In spot forex, true volume is unavailable, but a time-based version still works.
The key ideas: the point of control is the price with the most time spent, the value area covers roughly 70 percent of the day's activity, and low-activity zones are places price tends to move through fast.
For scalpers, the prior day's value area edges become reference points. A move outside and back inside the value area often continues to the opposite side. A rejection at the edge can offer a short-term fade.
The method needs consistent session definitions, since profile shape depends on the chosen hours. Between London, New York and Asia, the same day produces very different profiles.
Does a profile approach get used, and which session defines the day?
Re: Weekly Profile, Reading the Story of the Week
Posted: Thu Nov 05, 2026 10:25 am
by Fairman
Noting which major events fell in each week next to the high and low days is a good test, and I'd bet your guess is right. Honestly I think my own Tuesday-Wednesday pattern only works in the quiet weeks, and I've been giving it credit that belongs to the calendar.
I'd set the test up like this. Take ten weeks, mark each as "NFP week", "central bank week", "both" or "clear". If the Tuesday high or low holds in, say, 5 of 6 clear weeks and only 1 of 4 in the others, that's a useful rule: use the profile only in clear weeks. With such small samples I'd not trust it heavily, but ten weeks is enough to see a rough shape.
For trading, I'd then plan the clear weeks differently. In a clear week, I'd fade the Monday extreme on Tuesday with a stop beyond it, 0.5 lots, 12 pips, 60 dollars risk. In a payrolls week, I'd reduce size to a third and wait for Friday.
One thing I haven't resolved is how to handle weeks with a Wednesday FOMC evening. The first two days feel like a coiled range, and I end up overtrading it out of boredom.
Do you also separate holiday weeks, like those around US Thanksgiving, when volume is thin? And what window length do you use for the review, ten weeks or longer?